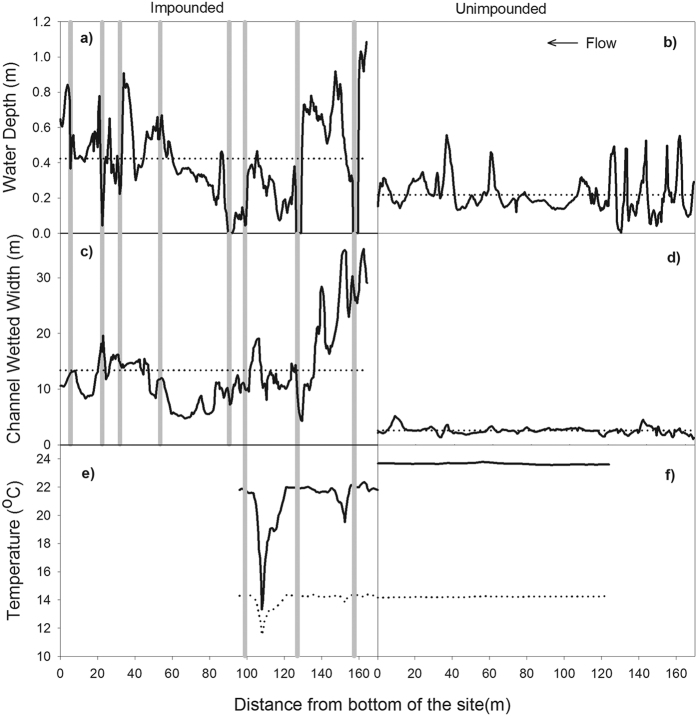
Figure 6. Longitudinal profile of stream characteristics.
Water depth and channel width was determined from topographic survey information in 2013 in impounded TR-4 (panel a & c) and unimpounded RR-4 (panel b & d) sites, solid line is the metric value for each location, dotted line is the mean value for the reach. Longitudinal temperature profiles (panel e & f) were obtained from multiple temperature loggers in TR-4 (see Fig. 5) and an unimpounded reach just upstream (between TR-4 and CR-4). The solid line is maximum and dotted line is minimum temperatures. Grey vertical lines represent the locations of dams.

