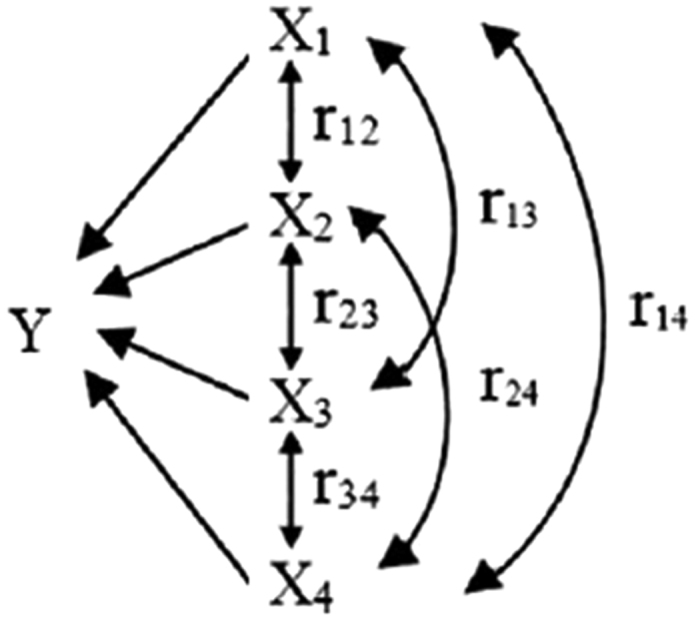
Figure 10. Network of path analysis.

X1, X2, X3 and X4 are independent variables; Y is dependent variable. rab represents the correlation coefficient between independent variables a and b.

X1, X2, X3 and X4 are independent variables; Y is dependent variable. rab represents the correlation coefficient between independent variables a and b.