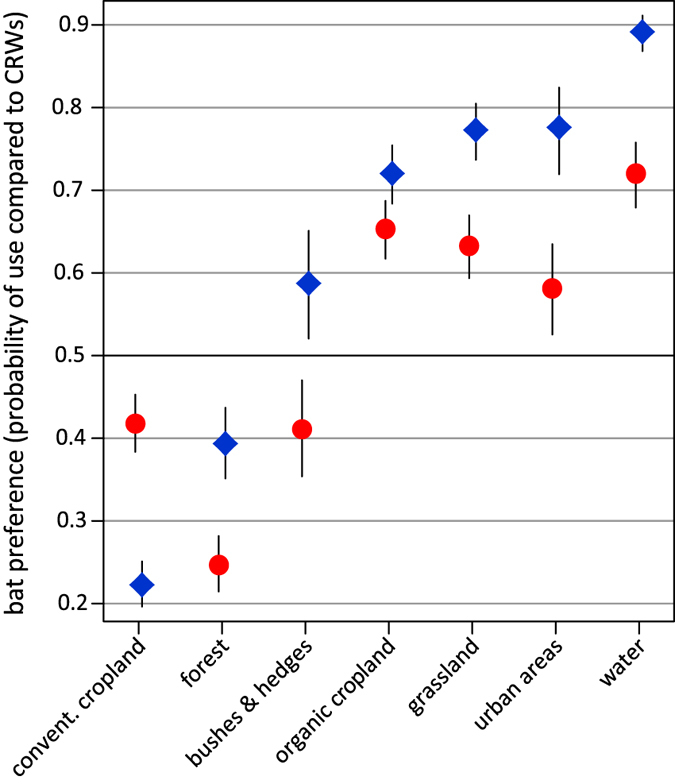
Figure 3. Probability of bat presence for the respective land use categories.

Probability values greater than 0.5 indicate that it was more likely to find bats, values smaller 0.5 indicate that it was less likely to find bats in the respective habitat based on the availability of the habitat. Red points represent data from female, blue squares represent data from male N. noctula. Whiskers represent 95% confidence intervals.
