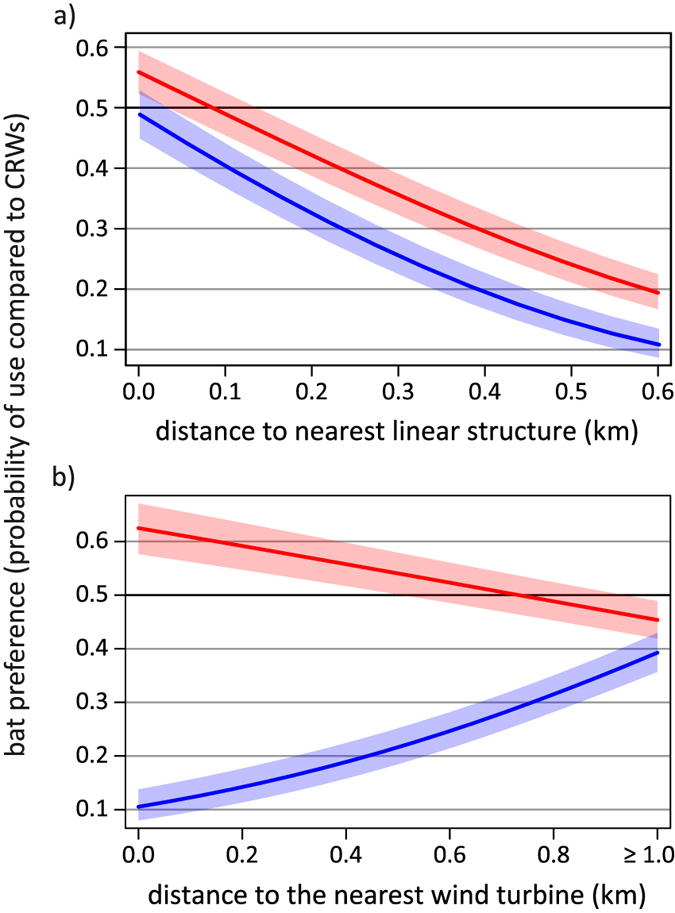
Figure 4. Probability of bat presence in relation to distance towards linear structures (a) and distance towards wind turbines (b).

Probability values greater than 0.5 indicate that it was more likely to find bats, values smaller 0.5 indicate that it was less likely to find bats at the respective distance. The red lines represents data from female and the blue lines those from male N. noctula. Bands show the 95% confidence intervals.
