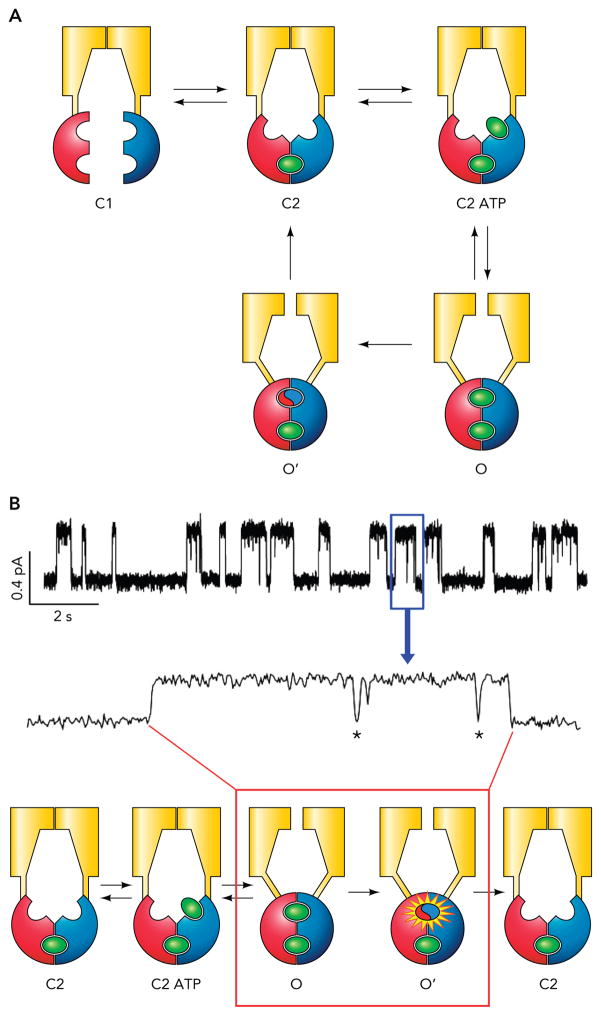
FIGURE 2. Traditional strict coupling model for CFTR gating.
A: the strict coupling model demands a one-to-one stoichiometry between the ATP hydrolysis cycle and the gating cycle. Notably, the rate of C2 → C1 transition is slow (~0.03 s−1); therefore, in the continuous presence of ATP, the channel rarely visits the C1 state. B: a cartoon that shows how the gating transitions described in A correspond to a WT-CFTR opening event. The C1 is not included for the reason mentioned above. Also note those briefly closed events known as flickers (marked by asterisk) within an opening burst.

