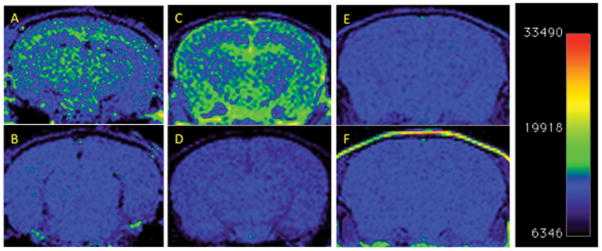
Figure 3.
T1 weighted MR Imaging of amyloid deposits in mouse models, pre- and 4 days post i.v. injection of nanoparticle MR agent. A 2D Spin-echo sequence, (TE=32ms, TR=770ms, Slice Thickness=1.2mm, FOV = 30×30mm, matrix=156×156, NEX=2) was used. Coronal 2D slices of the brain through the cortex and hippocampus are shown. Window Level and Window Width are set identically for each pair of images A-B, C-D, E-F. (A) TetO/APPswe-ind mouse, 15 months old, APP production suppressed until 6 weeks of age by doxycycline in diet. (B) Pre-injection scan of same mouse. (C) Tg2576 mouse (APPswe) 9 months old, and (D) Pre-injection scan of same mouse. (E) Tg2576 mouse injected with untargeted (non amyloid-binding) particles (F) Non transgenic sibling of E, injected with amyloid-targeted particles. Total signal was mapped to a “rainbow” color map using Osirix software, the range from the predominant blue background to green foreground represents a >2x signal increase, and the range from green to yellow a further 2x increase. 9 month old Tg2576 mice show a different pattern of labeling (pial, hippocampal and some signal in the ventricles) compared to older TetO/APP mice, (extensive cortical and hippocampal signal with no ventricular signal) suggesting slow clearance from the CSF in the Tg2576 example. Images are consistent with 6/6 animals in TetO/APPswe-ind group and 2/6 in the Tg2576 APP+ group. Subsequent immunohistochemical measurements showed that only these 2/6 Tg2576 animals had amyloid pathology, while the other 4/6 did not, consistent with the MRI signal.

