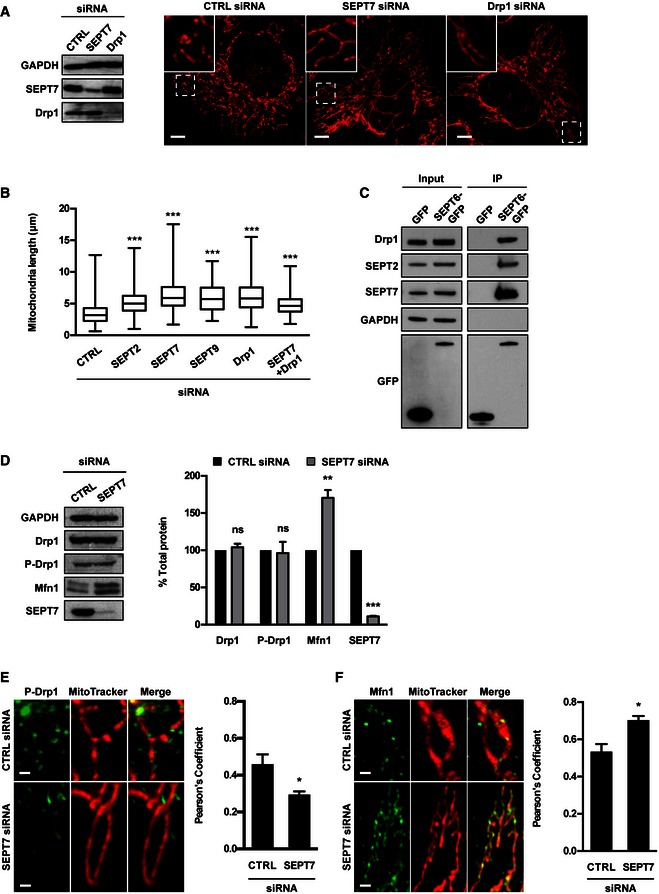
HeLa cells were treated with control (CTRL), SEPT7 or Drp1 siRNA for 72 h. Whole‐cell lysate of siRNA‐treated cells were immunoblotted for GAPDH, SEPT7 or Drp1 to show the efficiency of siRNA depletion. GAPDH was used as a loading control. siRNA‐treated cells were labelled with MitoTracker Red CMXRos and fixed for confocal microscopy. The scale bar represents 5 μm.
HeLa cells were treated with control (CTRL), SEPT2, SEPT7, SEPT9, Drp1 or SEPT7 + Drp1 siRNA for 72 h, labelled with MitoTracker Red CMXRos and fixed for quantitative confocal microscopy. Graph represents the length (μm; whiskers from min to max) of mitochondria in siRNA‐treated cells from three independent experiments (analysis of at least 100 measurements per biological replicate). Student's t‐test, ***P < 0.001.
HeLa cells stably expressing SEPT6‐GFP were harvested and then tested with Co‐IP. HeLa cells expressing GFP were used in parallel as control. GFP‐trap magnetic agarose beads were used to isolate SEPT6‐GFP from cells, and extracts were immunoblotted for Drp1, SEPT2, SEPT7 or GFP. The lysates were immunoblotted for GAPDH as control for cellular protein levels.
HeLa cells were treated with control (CTRL) or SEPT7 siRNA for 72 h, and whole‐cell lysates were immunoblotted for SEPT7, Drp1, phosphorylated Drp1 (P‐Drp1) or Mfn1. GAPDH was used as a loading control. Graph represents the mean % ± SEM of the relative amount of Drp1, P‐Drp1, Mfn1 or SEPT7 proteins quantified by densitometry from 4 independent experiments. Student's t‐test, ns: non‐significant; **P < 0.01, ***P < 0.001.
HeLa cells were treated with control (CTRL) or SEPT7 siRNA for 72 h, labelled with MitoTracker Red CMXRos, then fixed and labelled for endogenous P‐Drp1 for quantitative confocal microscopy. Representative images shown here. The scale bar represents 1 μm. The recruitment of P‐Drp1 to mitochondria was significantly decreased as compared to control cells as measured by Pearson's correlation coefficient from at least five independent experiments (mean ± SEM, analysis of at least 250 cells per biological replicate). Student's t‐test, *P < 0.05.
HeLa cells were treated with control (CTRL) or SEPT7 siRNA for 72 h, labelled with MitoTracker Red CMXRos, then fixed and labelled for endogenous Mfn1 for quantitative confocal microscopy. Representative images shown here. The scale bar represents 1 μm. The recruitment of Mfn1 to mitochondria was significantly increased as compared to control cells as measured by Pearson's correlation coefficient from at least five independent experiments (mean ± SEM, analysis of at least 250 cells per biological replicate). Student's t‐test, *P < 0.05.

