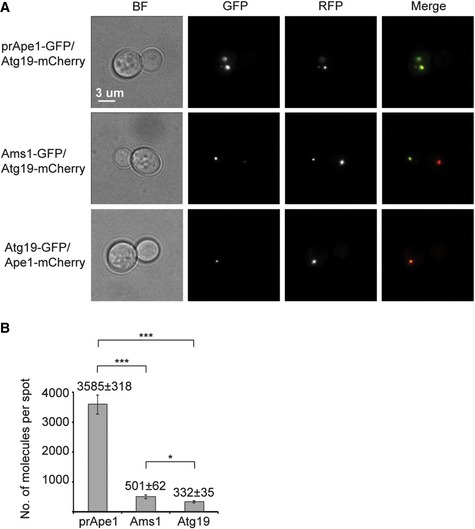
Figure 4. Quantification of the Ape1, Ams1, Atg19 protein abundances in living cells.

- Epifluorescence microscopy images of the prApe1‐GFP/Atg19‐mCherry/ypt7Δ, Ams1‐GFP/Atg19‐mCherry/ypt7Δ, Atg19‐GFP/Ape1‐mCherry/ypt7Δ Saccharomyces cerevisiae cells that were used to quantify the fluorescence intensity of GFP spots. Only colocalizing GFP and RFP spots were considered. BF represents bright‐field images.
- Bar plot showing the number of molecules of prApe1, Ams1, and Atg19 found in Cvt vesicles in living cells. Data are representative of two independent experiments in which a total of 217 prApe1‐GFP, 181 Ams1‐GFP, and 233 Atg19‐GFP spots were analyzed. Error bars indicate standard deviation (SD). ***P < 0.001; *P = 0.0176 (Z test).
