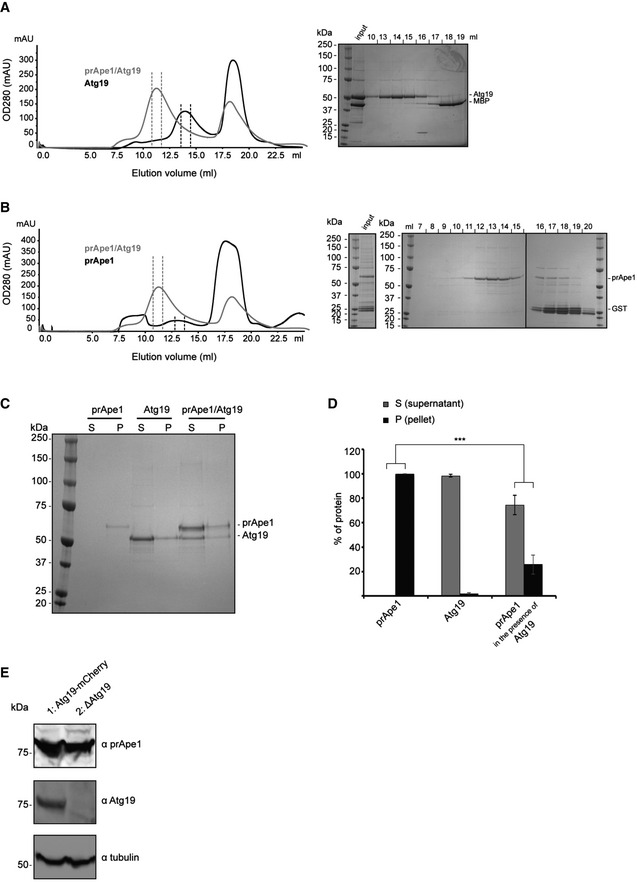
Figure EV4. Atg19 solubilization effect on prApe1 dodecamers (related to Fig 3).

- Size‐exclusion chromatography profile (Superose 6 column) of Atg19 after anti‐MBP‐Atg19 purification and cleavage of the MBP tag (left). Shown in gray is the overlay with the profile of the prApe1/Atg19 complex after anti‐MBP‐Atg19 purification and cleavage of the MBP tag. SDS–PAGE of peak fractions of the gel filtration profile of Atg19 (right).
- Size‐exclusion chromatography profile (Superose 6 column) of prApe1 after anti‐GST‐prApe1 purification and cleavage of the GST tag (left). Shown in gray is the overlay with the profile of the prApe1/Atg19 complex after anti‐MBP‐Atg19 purification and cleavage of the MBP tag. SDS–PAGE of peak fractions of the gel filtration profile of prApe1 (right). Samples were run on three separate gels.
- Representative SDS–PAGE of pelletation assay of purified prApe1 dodecamers alone, purified Atg19 alone, and the purified prApe1/Atg19 complex.
- Bar plot of gel band intensities from supernatant and pellet fraction of (C).
- Western blot of prApe1 (top) and Atg19 (bottom) showing clarified lysate from prApe1‐GFP/Atg19‐mCherry/ypt7Δ (lane 1) and prApe1‐GFP/Atg19Δ/ypt7Δ (lane 2) Saccharomyces cerevisiae cells.
