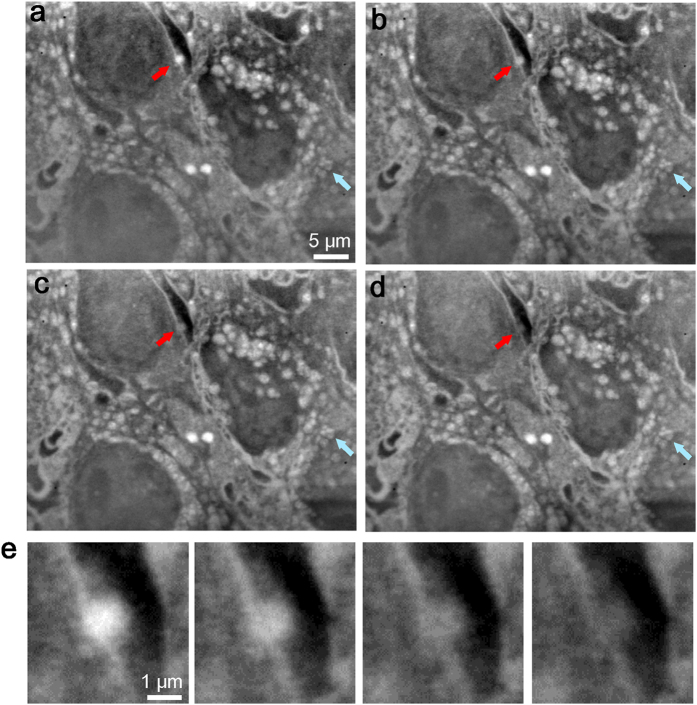
Figure 4. Examination of structural changes within cells using multi-scanned SE-ADM images.
(a) Initial image of untreated cultured cells in medium using an 8-kV EB and 2,500× magnification. (b) Second observation image of the same area as in (a). (c) Third observation image. (d) Fourth scanned image of the same cells in medium. Red and blue arrows correspond to moving structures and/or changes in contrast. (e) Enlarged images of a vesicle that exhibited contrast changes throughout the four observations, as indicated by the red arrows in the upper parts of (a–d). The scale bars represent 5 μm in (a) and 1 μm in (e).

