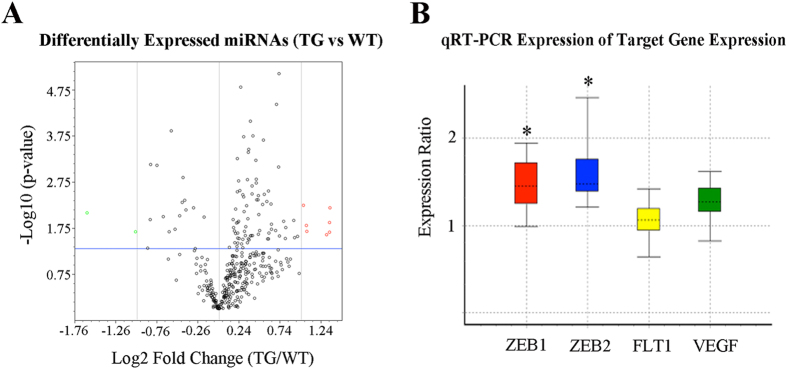
Figure 1. Differentially expressed miRNAs 3 months after Müller cell disruption and its target gene validation with qRT-PCR.
(A) Volcano plot showing differentially expressed miRNAs 3 months after selective Müller cell disruption. Red circles represent upregulated miRNAs and green circles indicate downregulated miRNAs. Vertical grey lines indicate fold changes, with a cut off ±2. The horizontal blue line represents a p-value of 0.05. n = 6 in each group. (B) qRT-PCR analysis of genes targeted by miR-200b after selective Müller cell disruption. qRT-PCR was conducted using retinas collected 3 months after induced Müller cell disruption. The boxes represent the interquartile range. The dotted lines within the boxes represent medians of gene expression. The whiskers indicate the maximum and minimum values of gene expression. *P < 0.05, transgenic vs wild type, n = 6 in each group.

