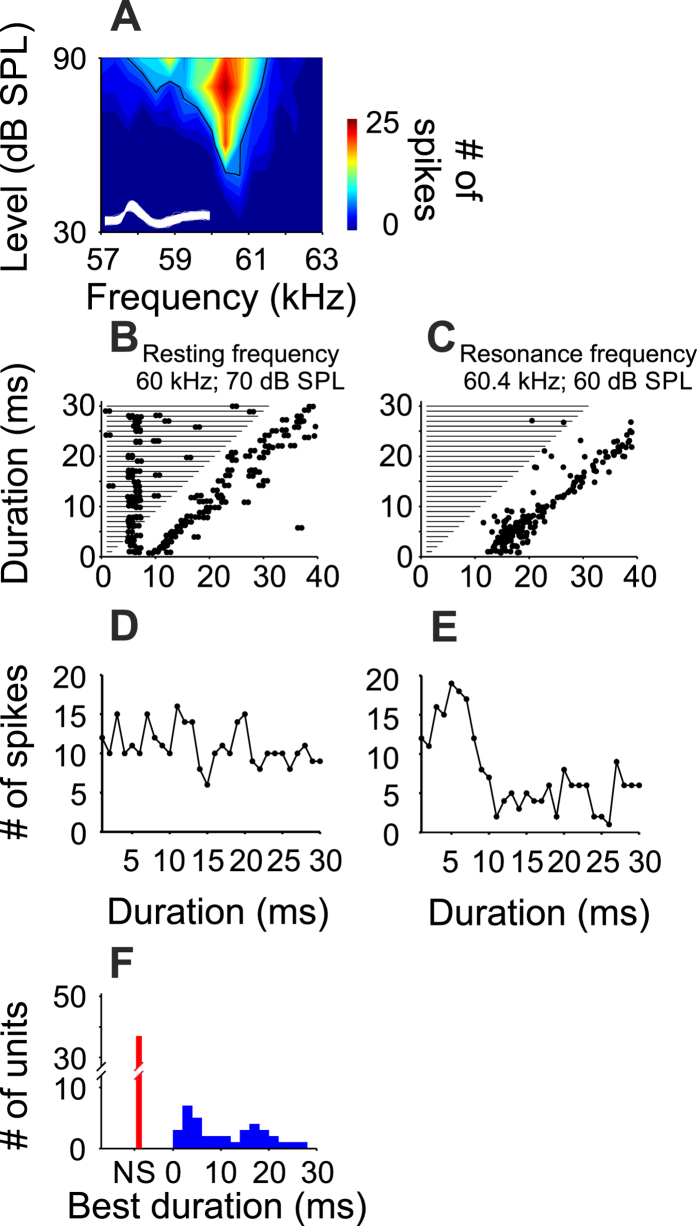
Figure 5. Tuning curve and duration tuning properties of a RF-DTN.
(A) FRA. Two milliseconds of the action potential waveforms (y-axis in arbitrary units) obtained after spike sorting are shown inside the FRA. (B,C) Duration response dot-raster display in response to the resting and the resonance frequency. (D,E) Duration-tuning curves measured at the resting and resonance frequencies. (F) Distribution of best durations measured in 37 RF-DTNs in response to the resting frequency (red bars) and resonance frequency (blue bars). NS: no duration selectivity.

