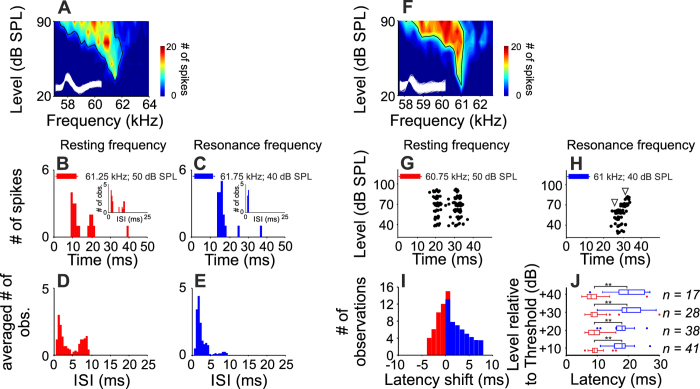
Figure 6. Temporal characteristics of the response of DTNs.
(A–C) FRA (A) and response pattern of a DTN in response to the resting (B) and the resting frequency (C). (B) PSTH in response to a 10 ms tone burst set at 10 dB above threshold for the resting frequency. Inset: Inter-spike interval histogram. (C) PSTH in response to a 10 ms tone burst set at 10 dB above threshold for the resonance frequency. Inset: Inter-spike interval histogram. (D,E) Average inter-spike interval histograms calculated for the response obtained at 10 dB above threshold for the resting frequency and the resonance frequency in 41 RF-DTNs. Histograms were constructed with bin widths of 1 ms. (F–H) FRA and dot raster histogram representing the timing of a spike relative to the stimulus onset with increasing sound level, obtained at the resting (G) and the resonance frequency (H). Two milliseconds of the action potential waveforms (y-axis in arbitrary units) obtained after spike sorting are shown inside the FRAs. (I) Histograms of the maximum latency shift observed in each neuron with increasing sound level in 41 units at the resting frequency (red bars) and the resonance frequency (blue bars). (J) Comparison between the latency of the response to the resting frequency and to the resonance frequency at 10, 20, 30 and 40 dB above threshold in all sampled RF-DTNs. Asterisks represent significant differences (paired t-tests,p < 0.001). The number of neurons included in the comparison for each level are indicated.

