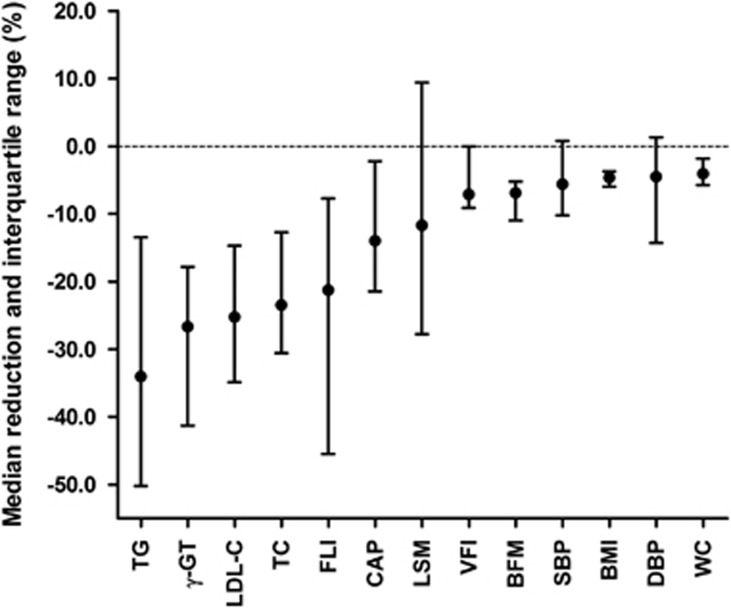
Figure 3.
Summary of significant reductions of key parameters assessed during the dietary intervention. The values are displayed as medians, interquartile range, and ordered based on the extent of reduction. BFM, body fat mass; BMI, body mass index; CAP, controlled attenuation parameter; DBP, diastolic blood pressure; FLI, fatty liver index; γ-GT, gamma-glutamyl transferase; LDL-C, low-density lipoprotein cholesterol; LSM, liver stiffness measurement; SBP, systolic blood pressure; TC, total cholesterol; TG, triglycerides; VFI, visceral fat index; WC, waist circumference.

