Figure 3.
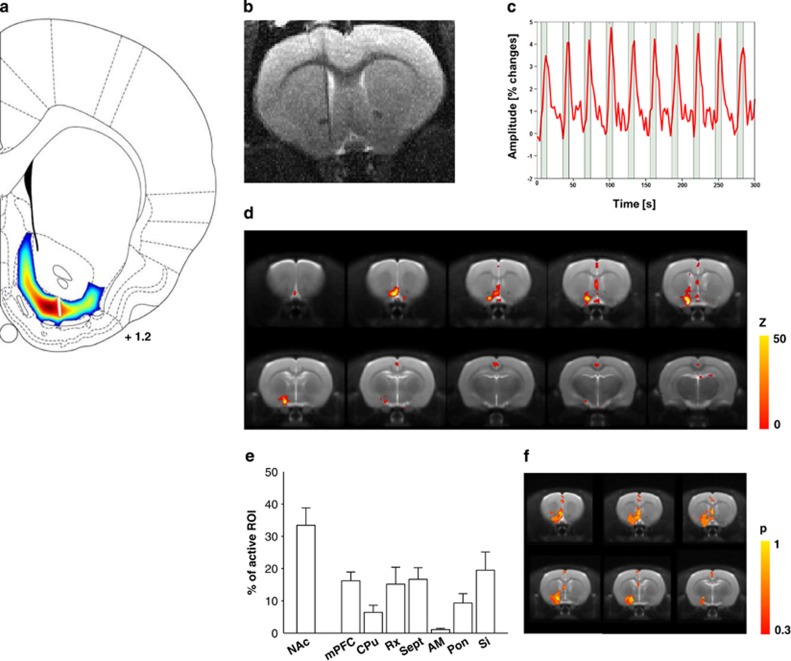
Electrical stimulation of the nucleus accumbens shell (NAcs) affects stimulation site and a well-defined set of associated brain regions. (a) Biophysical simulation of NAcs stimulation with the same stimulation parameters as used for the behavioral experiments. The propagation of the induced potential waves within the accumbal tissue as a dissipative and approximately isotropic media is decreasing with growing distance from the stimulation site and vanishes toward the boundaries of the simulation domain. Therefore, it is safe to assume that interactions with neighboring structures are negligible. The stimulation domain was defined by the surface spanned through the boundary of the NAcs as given by the Paxinos and Watson atlas of the rat brain. (b) A representative anatomical T2-weighted image with a location of a carbon-fiber electrode in the NAcs. (c) A typical blood oxygen-level-dependent (BOLD) signal time course evoked by DBS and recorded in the NAcs close to the electrode tip. (d) Electrical stimulation functional magnetic resonance imaging (Es-fMRI) BOLD maps (n=6, P<0.001, cluster size 14). Color code denotes the statistical significance (T-value). (e) Relative activation volumes of all regions showing statistically significant activation. AM, amygdala; CPu, caudate putamen; mPFC, medial prefrontal cortex; Pon, pons; Rx, retrosplenial cortex; Sept, septum; Si, substantia innominata. (f) Activation probability maps. Color code denotes the probability of activating a region by NAc stimulation (n=6, individual maps thresholded at P<0.001, cluster size 14).

