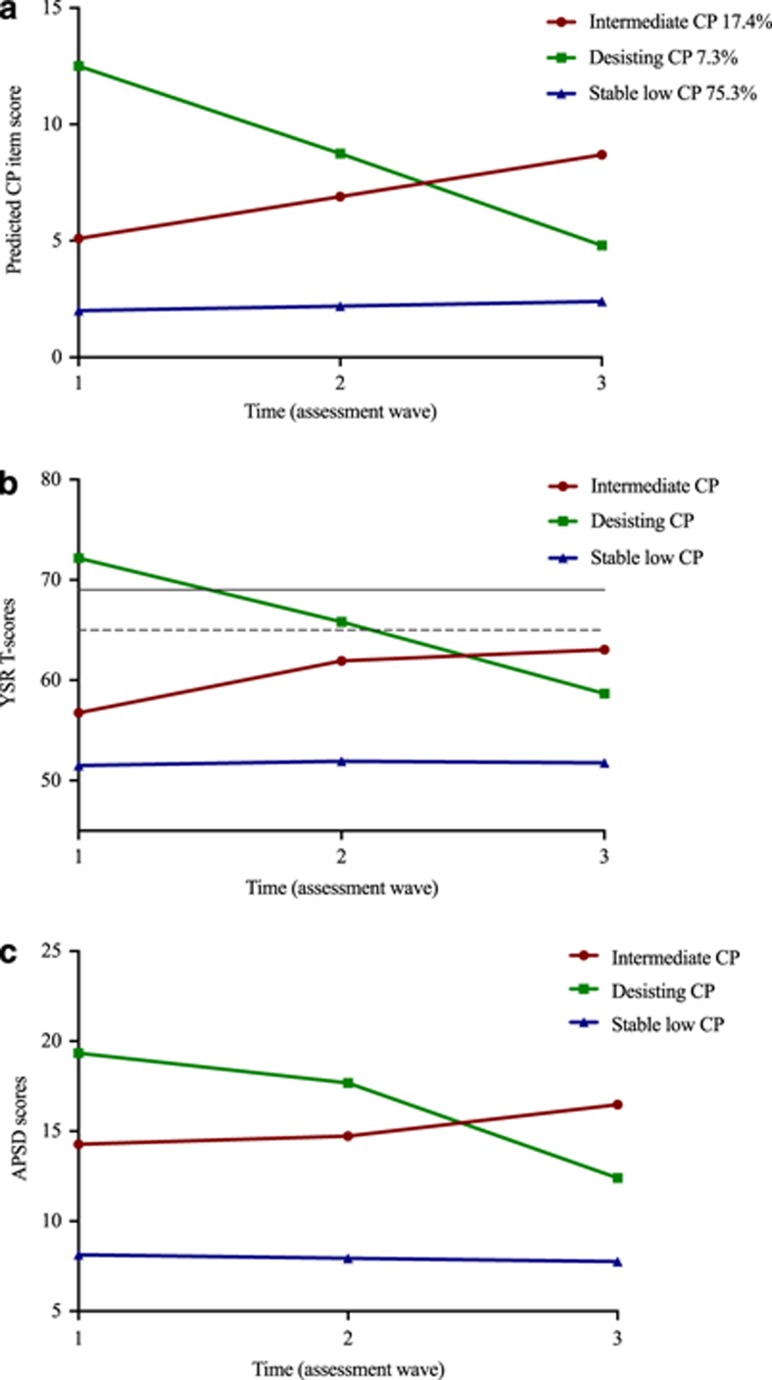
Figure 2.
Antisocial behavioral scores of the three conduct problem (CP) trajectory classes. (a) Mean CP-scores on the YSR for the LCGA classes per assessment wave. (b) T-Scores of the YSR for the three classes at each assessment wave. Note: Dotted line represents the sub-clinical cut-off and the solid line represents the clinical cut-off of the YSR conduct problem T-scores. (c) Scores of the Antisocial Personality Screening Device (APSD) for the three classes at each wave. LCGA, latent class growth analyses; YSR, Youth Self-Report.

