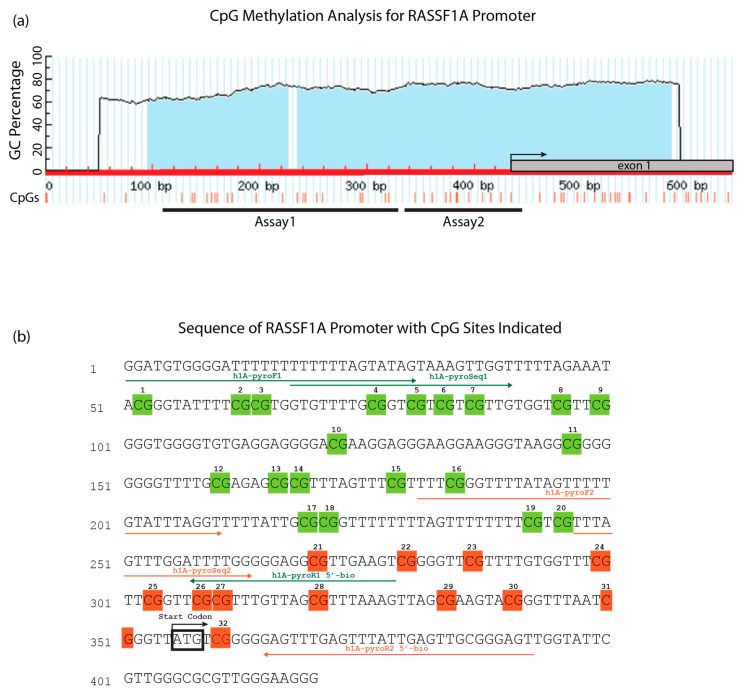
Figure 1.
RASSF1A CpG island map and the PyroMark assays. (a) Part of the RASSF1A CpG island, as predicted by MethPrimer [21]. CpG sites are indicated by red strikes. Pyrosequencing assay coverage is shown as black lines. The start codon is indicated by an arrow. (b) RASSF1A bisulfite-modified DNA sequence with the studied CpGs and primer locations. The start codon is indicated by a black rectangle. Twenty CpGs interrogated by Assay 1 are highlighted in green; the 12 CpG of Assay 2 are highlighted in orange.

