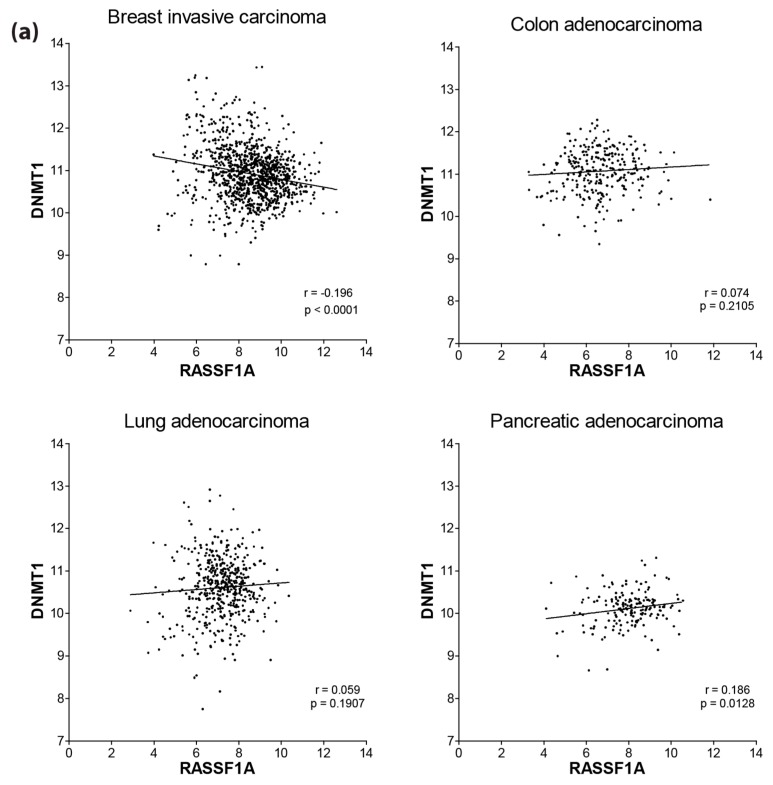
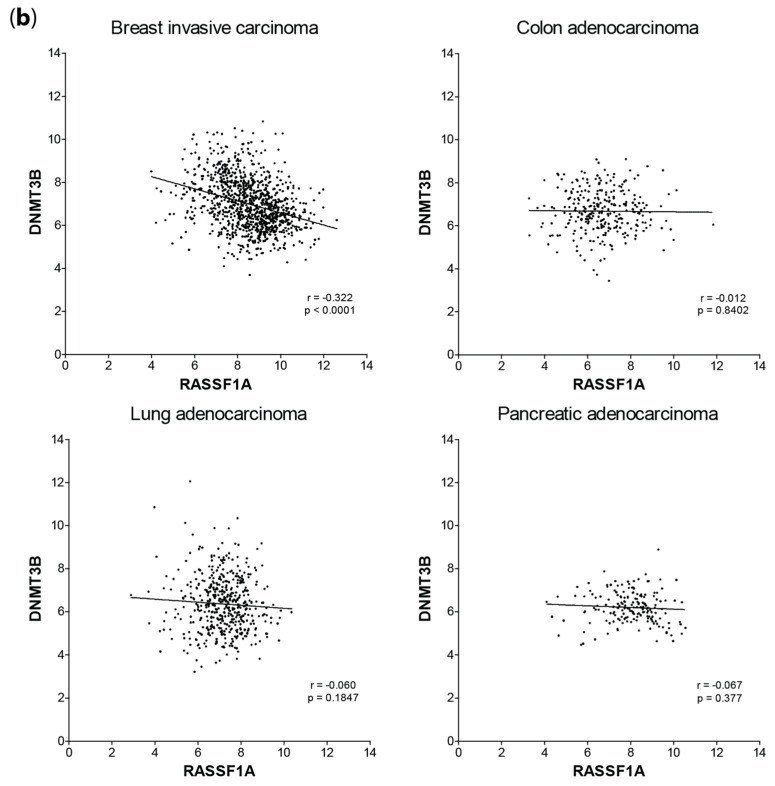
Figure 7.
Correlation of RASSF1A expression with DNMT1 and DNMT3B expression in patient tumors from different cancers. Scatterplot of the expression values (log2[RSEM+1]) of RASSF1A (horizontal) and (a) DNMT1 or (b) DNMT3B (vertical) for primary tumors from TCGA (The Cancer Genome Atlas) breast cancer (n = 1062), colorectal adenocarcinoma (n = 286), lung adenocarcinoma (n = 488) and pancreatic adenocarcinoma (n = 178) patient samples. Lines indicate linear regression; Spearman’s correlation coefficients and associated p-values are displayed in the bottom right corners.


