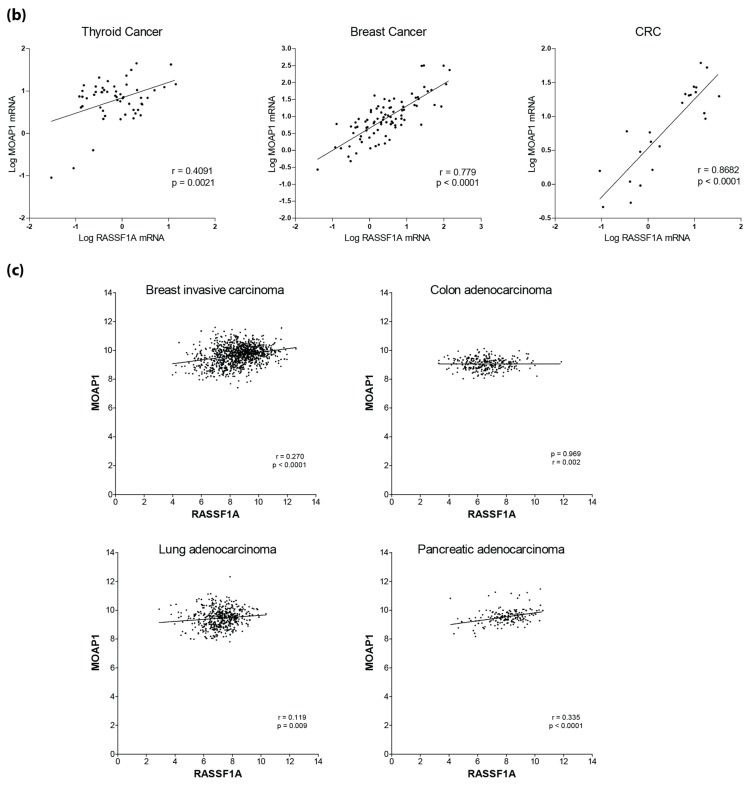
Figure 8.
MOAP-1 expression and its correlation with RASSF1A expression in different cancers. (a) MOAP-1 expression in different cancers (red) compared to normal (blue). TPB, TATA-binding protein. (b) Scatterplot of the expression values (normalized to GAPDH) of RASSF1A and MOAP-1 for thyroid (n = 55), breast (n = 77) and colorectal cancer (n = 31) patients. (c) Scatterplot of the expression values (log2[RSEM+1]) of RASSF1A (horizontal) and MOAP-1 (vertical) for primary tumors from TCGA breast cancer (n = 1062), colorectal adenocarcinoma (n = 286), lung adenocarcinoma (n = 488) and pancreatic adenocarcinoma (n = 178), patient samples. In (b,c), lines indicate linear regression; Spearman’s correlation coefficients and associated p-values are displayed in the bottom right corners.


