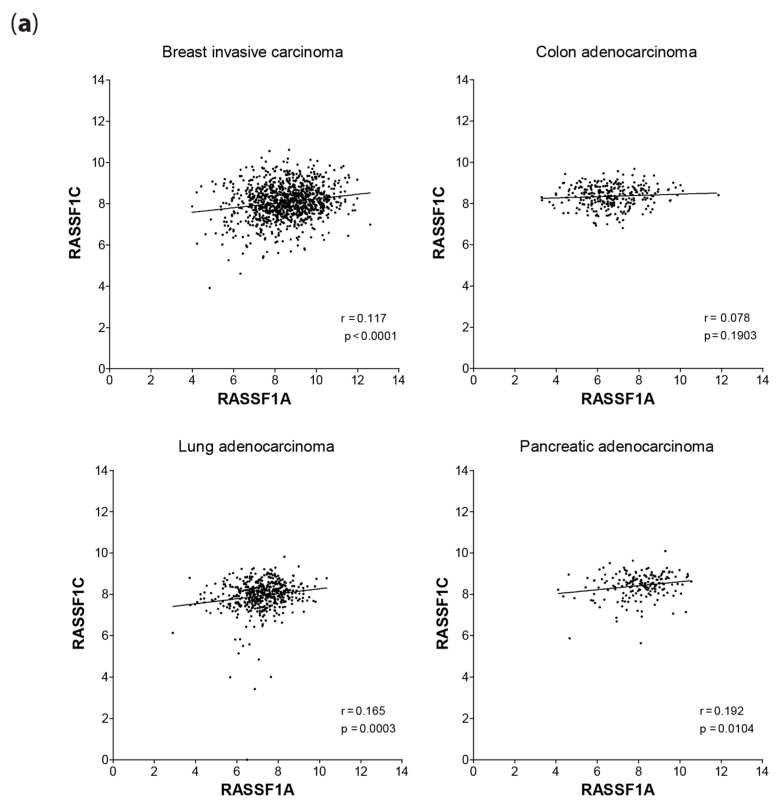
Figure 9.
Correlation of RASSF1A expression with RASSF1C expression in cancers. (a) Scatterplot of the expression values (log2[RSEM+1]) of RASSF1A and RASSF1C for primary tumors from TCGA breast cancer (n = 1062), colorectal adenocarcinoma (n = 286), lung adenocarcinoma (n = 488) and pancreatic adenocarcinoma (n = 178) patient samples. Lines indicate linear regression; Spearman’s correlation coefficients and associated p-values are displayed in the bottom right corners. (b) In breast, thyroid and colon cancer patients, RASSF1A and RASSF1C expressions were summed and the percentage of RASSF1A and RASSF1C expression calculated for each patient. Mean ± SD percentages are presented. For most breast cancers subtypes, n = 11–21; for thyroid cancer subtypes, n = 8–13; for colorectal cancers subtypes, CRC, n = 26; and liver metastasis, n = 5. Normal epithelial tissue was obtained from breast reduction surgery patients (n = 13) and used as normal tissue values for all three cancers. Expression of 1A has been shown on The Protein Atlas [44] and Genecards [45] databases to be comparable in these three tissue types.


