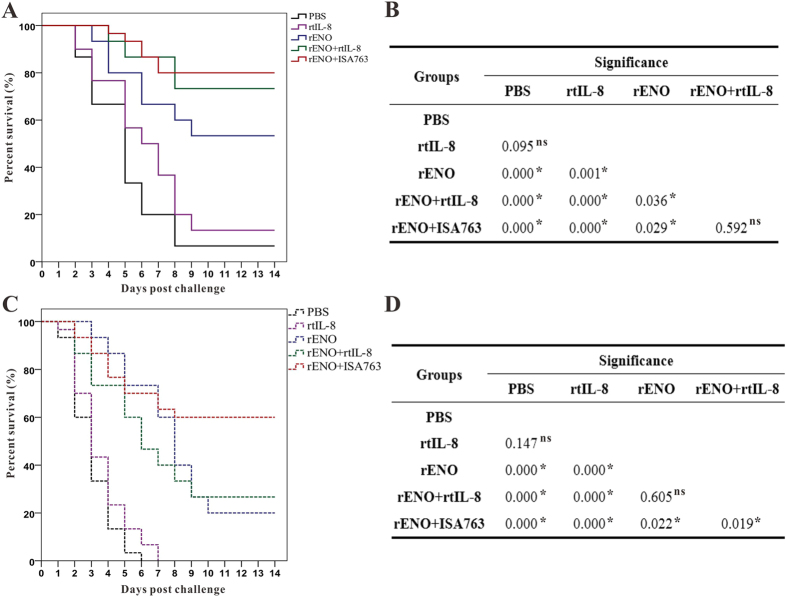
Figure 6.
Percent survivals (Kaplan-Meier) of vaccinated fish during the challenges tests of 4 week s.v. (A) and 8 week s.v. (C). Differences among groups were tested using log-rank test shown in (B) (4 week s.v.) and (D) (8 week s.v.). “*”Denotes significant difference (P < 0.05), “ns” means not significant.

