Figure 6.

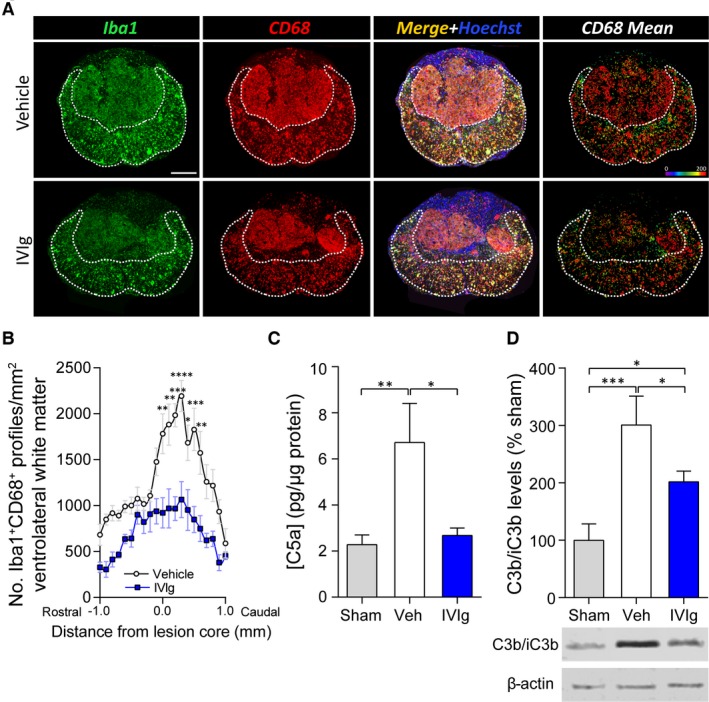
IVIg treatment reduces intraspinal presence of activated macrophages and complement activation products. (A) Representative histological sections of the lesion epicenter at 35 days post‐spinal cord injury (SCI) from vehicle‐treated controls (top row) or mice administered IVIg (1 g/kg) (bottom row). The dotted white line delineates the area of spared tissue. The “CD68 Mean” panels (right column) show the mean area (pixel units) of CD68 staining per Iba1+CD68+Hoechst+ cell. (B) Note that IVIg treatment significantly reduced the number of Iba1+CD68+Hoechst+ cells in the VLWM in sections within 100 μm rostral to 500 μm caudal of the lesion epicenter. (C) Analysis of C5a levels in the injured spinal cord segment at 1 day post‐injury. Note the reduction in tissue C5a levels following IVIg treatment of SCI mice. (D) Western blot data from spinal cord homogenates of SCI mice showing that IVIg treatment also attenuated tissue C3b levels. (B) Mean ± SEM; *P < 0.05; **P < 0.01; ***P < 0.001; ****P < 0.0001; two‐way analysis of variance (ANOVA) with Bonferroni post hoc test; n = 6–7. (C, D) Mean ± SEM; *P < 0.05; **P < 0.01; ***P < 0.001; one‐way ANOVA with Newman–Keuls post hoc test; n = 5–6. Scale bar: A (top left): 200 μm.
