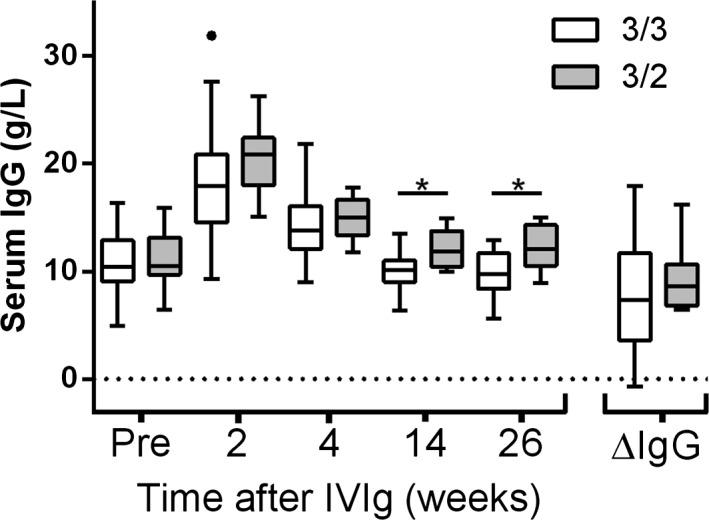
Figure 2.

Serum Immunoglobulin G (IgG) levels before treatment, after treatment at standardized time points (2, 4, 14, and 26 weeks) and the difference between the IgG level after 2 weeks and pr‐treatment IgG level (∆IgG). Groups are based on FcRn promoter alpha‐chain genotype, variable number of tandem repeats (VNTR). Data presented as mean and whiskers according to Tukey. * denotes a significant difference.
