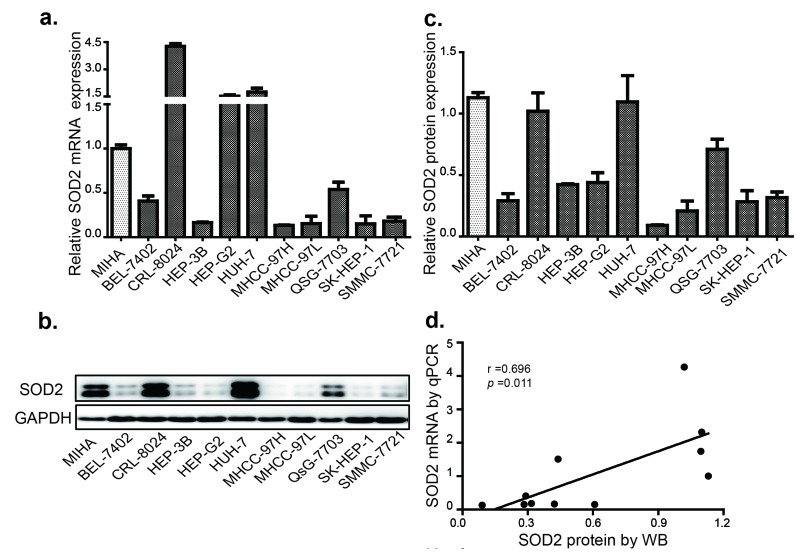
Figure 3. SOD2 expression is decreased in HCC and cell lines.
(a) The relative expression of SOD2 mRNA in HCC cell lines. (b) The SOD2 protein expression in HCC cell lines as determined by Western blot. (c) Quantification of the results from Fig. 3b. (d) Correlation of SOD2 mRNA and protein expression in HCC cell lines. Statistical analysis was conducted by Paired-Samples t-test.

