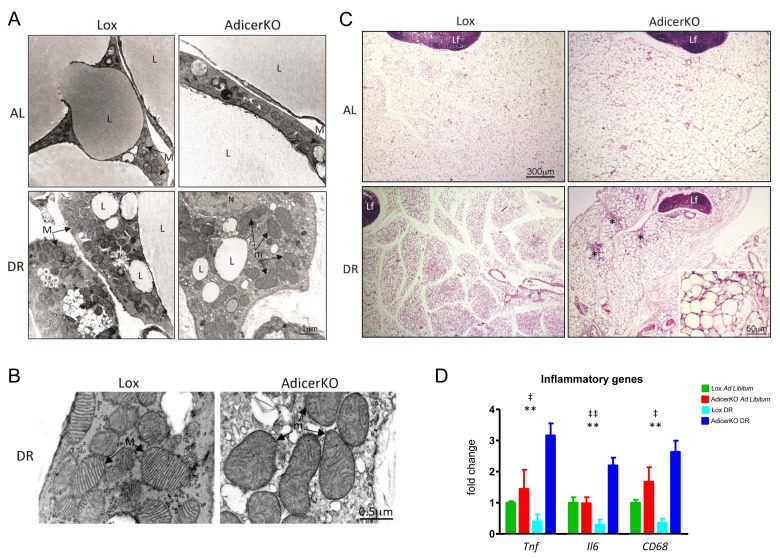
Figure 4. Morphology of white adipose tissue of AdicerKO mice.
Twelve-week old mice were subjected to ad libitum (AL) or dietary restriction (DR) regimens for one (A-C) or three (D) months. Inguinal white adipose tissue (WAT) was isolated and analyzed at the (A,B) ultrastructure level (electron microscopy) or at the (C) histological level (H&E) (N=4-5 animals per condition). L, lipid droplet. M, healthy mitochondrium. m, damaged hypertrophic mitochondrium. Lf, lymph node. N, nucleus. *, fibrosis. (D) Inflammation markers were assessed by RT-qPCR (N=3-4 per condition). Mean ± SEM. ** P < 0.01 for genotype effect; ‡ P < 0.05, ‡‡ P < 0.01 for diet-genotype interaction.

