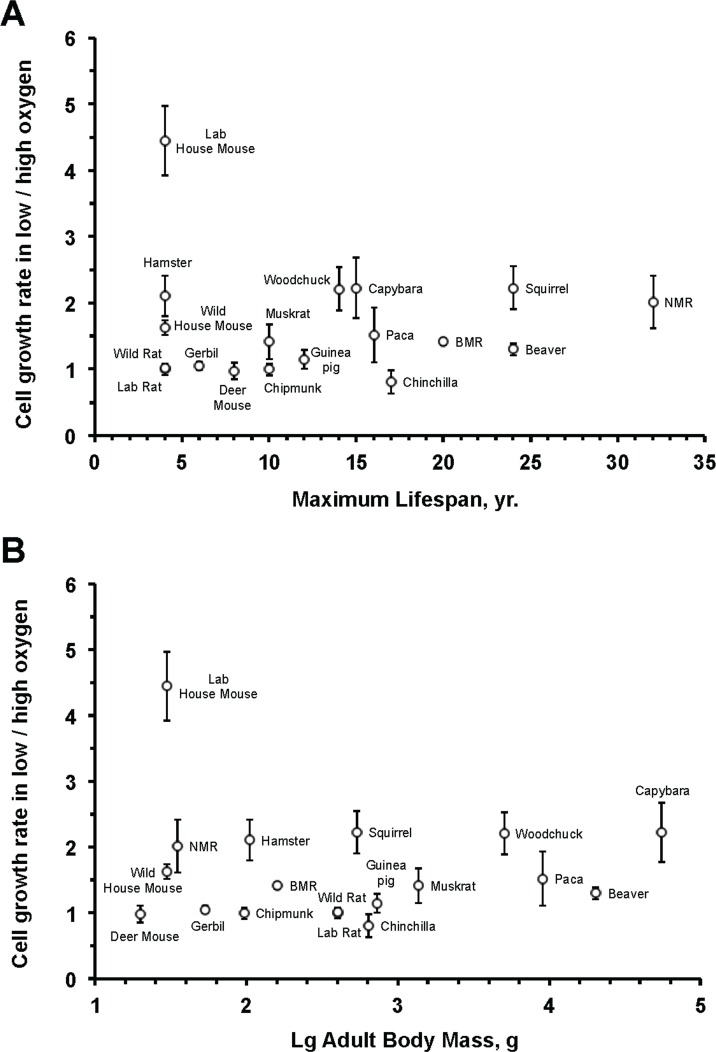
Figure 2. Fibroblast sensitivity to oxygen does not correlate with maximum lifespan (A) or body mass (B).
The sensitivity to oxygen environment is reflected by the ratio between the growth rate at 3% and 21% oxygen. The rate of cell proliferation in 3% or 21% oxygen is the slope of the regression line shown in Figure 1. No significant correlation was observed between oxygen sensitivity and maximum lifespan (r2 = 0.0001; P = 0.97) or oxygen sensitivity and body mass (r2 = 0.006; P = 0.76). The correlation remained non‐significant after an outlier (laboratory mouse) was excluded: oxygen sensitivity and maximum lifespan (r2 = 0.135; P = 0.15); oxygen sensitivity and body mass (r2 = 0.075; P = 0.29).

