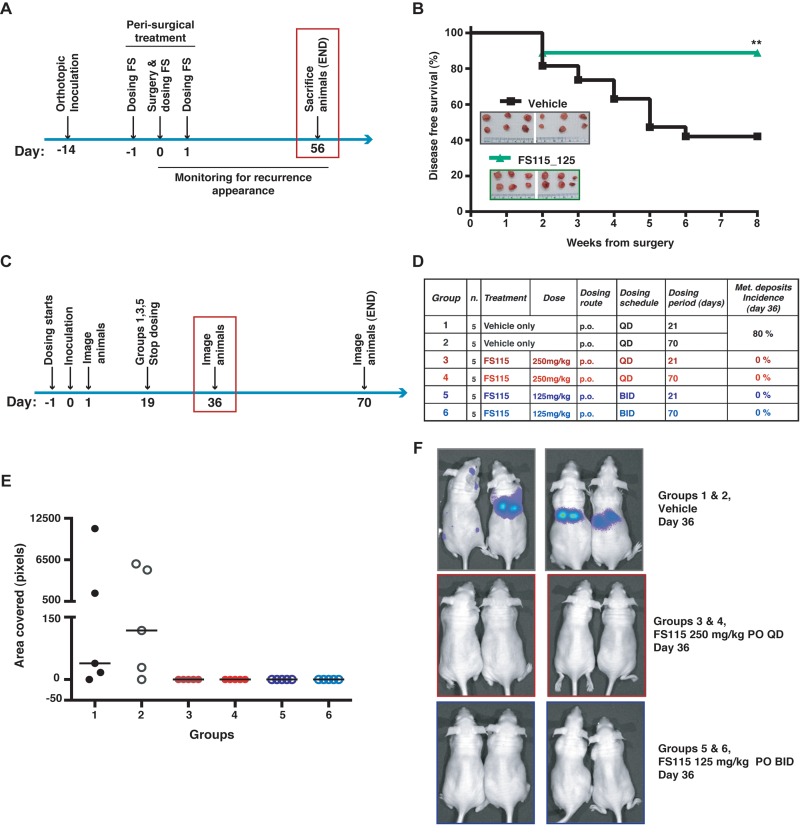
Figure 5. FS-115 suppresses breast cancer local recurrence and metastatic spread.
(A) Schematic representation of the experimental workflow used for the local recurrence formation experiment. (B) Graph reports the disease free survival curve of the mice injected with MDA-MB-231 cells (1×10⁶), and then peri-operatively treated with FS-115 (125mg/kg, BID) or vehicle. In the inset, pictures of the primary tumors collected the day of surgery (day 0) are shown. (C) Schematic representation of the experimental workflow used for the metastasis formation experiment. Mice were intracardiacally injected with MDA-MB-231-luc cells (1×10⁵) and imaged at the mid-point of study (36 days after inoculation). (D) Table describes the different experimental groups in which mice were subdivided to test different FS-115 concentrations and different treatment schedules. Percentage of metastatic deposits incidence, calculated at day 36 in each group, is also indicated. (E) Graph reports the quantification of the area covered by metastatic deposits (pixels), in the different experimental groups, imaged using a Xenogen IVIS machine, after injection with D-luciferin. (F) Pictures show two representative animals/group from the experiment described in (C), (D) and (E). In all cases, differences were considered significant when p<0.05 (*) and calculated by two tailed t-test. In all cases, differences were considered significant when p<0.05 (*) and calculated by two tailed t-test.

