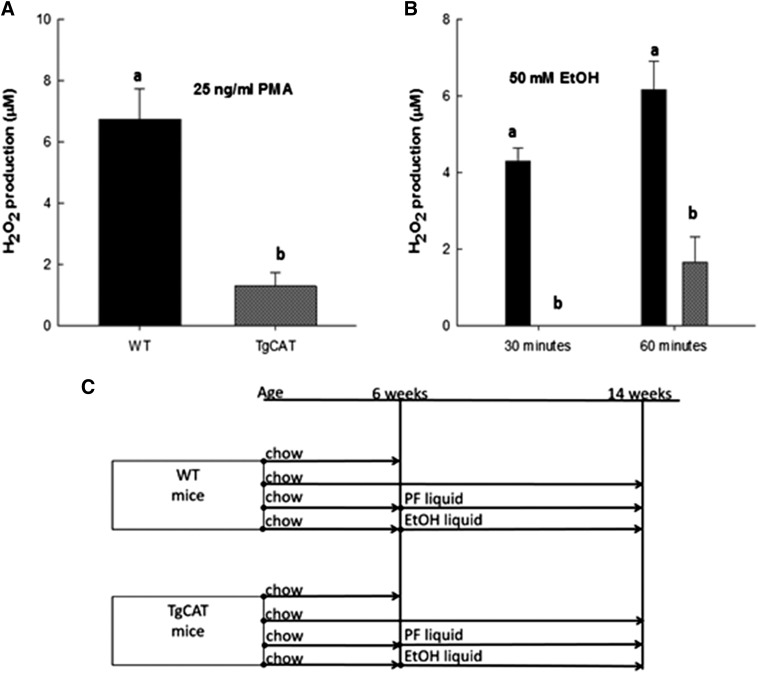
Fig. 1.
Hydrogen peroxide measurements in primary bone cells after stimulation with 25 ng/ml PMA (A) and 50 mM EtOH (B). Statistical differences were determined by Student’s t test; values with different letter subscripts are statistically different from each other (P < 0.05). (C) Design of the feeding studies.

