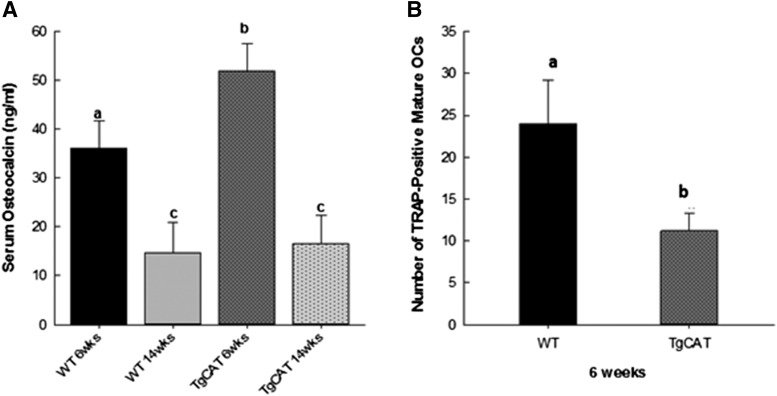
Fig. 2.
(A) Measurement of serum osteocalcin concentration from 6- and 14-week-old WT and TgCAT mice. Statistical significance was determined by one-way analysis of variance followed by Student-Newman-Keuls post hoc analysis; values with different letter subscripts are statistically different from each other (P < 0.05). (B) Total number of mature osteoclasts from WT and TgCAT bone marrow cells as identified by TRAP staining after culture in media containing 15 ng of RANKL and 20 nM 1,25(OH)2D3 for 10 days. Statistical differences were determined by Student’s t test; values with different letter subscripts are statistically different from each other (P < 0.05). OC, osteocalcin.

