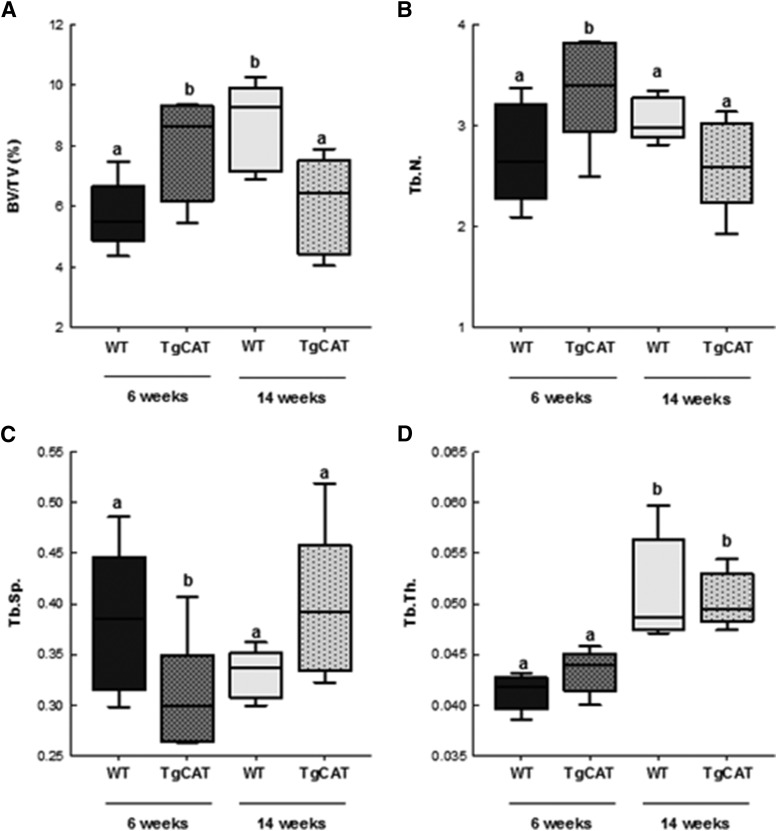
Fig. 3.
MicroCT analysis of tibial trabecular bone—BV/TV percentage (A), Tb.N (B), Tb.Sp (C), and Tb.Th (D)—in 6- and 14-week-old WT and TgCAT mice. Data are expressed with the center line indicating the mean and error bars as ± S.E.M. Statistical significance was determined by two-way analysis of variance followed by Student-Newman-Keuls post hoc analysis. Values with different letter subscripts are statistically different from each other (P < 0.05).

