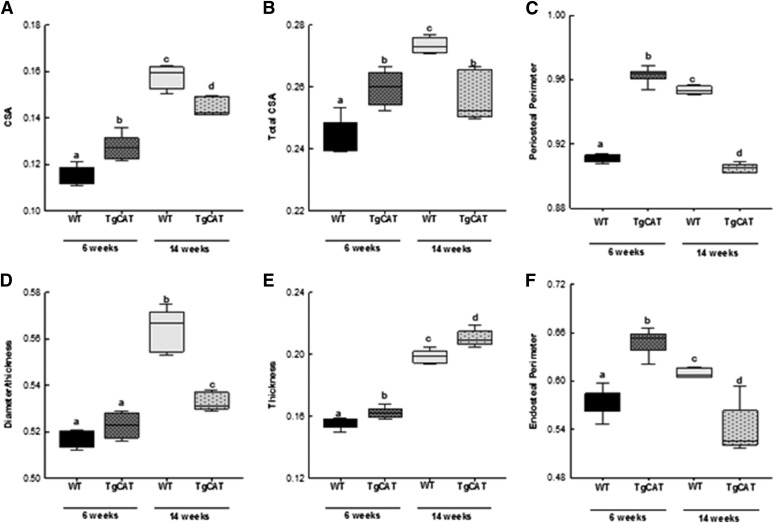
Fig. 5.
MicroCt analysis of tibial cortical bone—cross-sectional area (A), total cross-sectional area (B), periosteal perimeter (C), diameter (D), thickness (E), and endosteal perimeter (F)—in 6- and 14-week-old WT and TgCAT mice. Data are expressed with the center line indicating the mean and error bars as ± S.E.M. Statistical significance was determined by two-way analysis of variance followed by Student-Newman-Keuls post hoc analysis. Values with different letter subscripts are statistically different from each other (P < 0.05).

