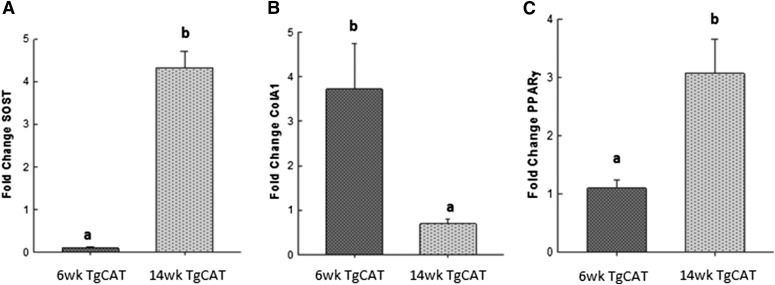
Fig. 7.
Total mRNA was extracted from 6- and 14-week-old femurs of TgCAT mice, and expression of sclerostin (A), collagen 1 (B), and PPARγ (C) was compared. Statistical differences were determined by Student’s t test; values with different letter subscripts are statistically different from each other (P < 0.05). SOST, Sclerostin.

