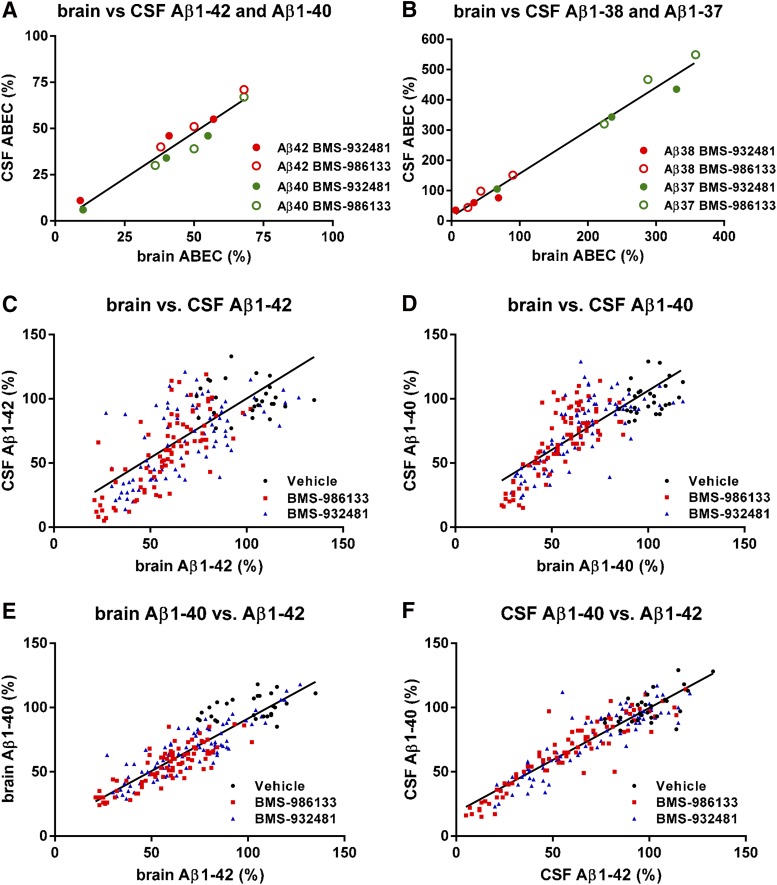
Fig. 3.
The effects of GSMs on Aβ levels in brain and CSF are correlated. ABEC was calculated for brain and CSF Aβ1-42, Aβ1-40, Aβ1-38, and Aβ1-37 at each dose of BMS-932481 and BMS-986133 in the rat study illustrated in Fig. 2 and Supplemental Figs. 3–5. (A) ABECs for CSF Aβ1-42 and CSF Aβ1-40 were plotted against the corresponding ABECs for brain Aβ1-42 and brain Aβ1-40. Linear regression showed a best fit of y = 0.99*x – 1.7, r2 = 0.93, P < 0.0001. (B) ABECs for CSF Aβ1-38 and CSF Aβ1-37 were plotted against the corresponding ABECs for brain Aβ1-38 and brain Aβ1-37. Linear regression showed a best fit of y = 1.4*x + 14, r2 = 0.98, P < 0.0001. (C) Scatter plot for brain Aβ1-42 and CSF Aβ1-42 from individual rats (total of 196 rats). Linear regression showed a best fit of y = 0.92*x + 7.9, r2 = 0.34, P < 0.0001. (D) Scatter plot for brain Aβ1-40 and CSF Aβ1-40 from individual rats. Linear regression showed a best fit of y = 0.922*x + 14, r2 = 0.61, P < 0.0001. (E) Scatter plot for brain Aβ1-42 and brain Aβ1-40 from individual rats. Linear regression showed a best fit of y = 0.82*x + 9.8, r2 = 0.78, P < 0.0001. (F) Scatter plot for CSF Aβ1-42 and CSF Aβ1-40 from individual rats. Linear regression showed a best fit of y = 0.81*x + 19, r2 = 0.85, P < 0.0001.

