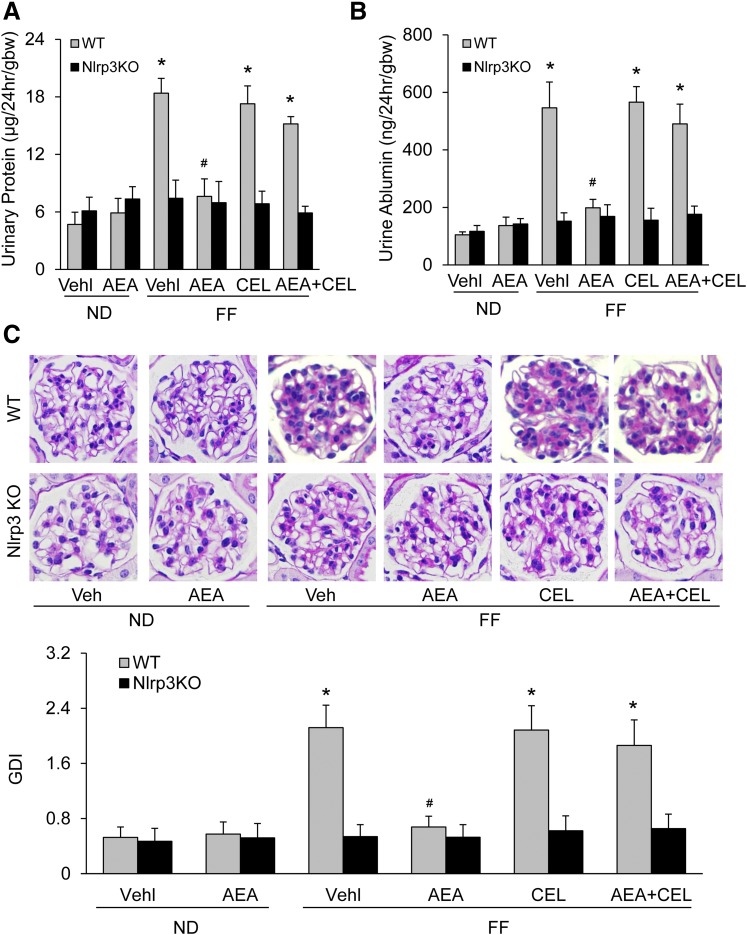
Fig. 3.
Prevention by AEA of hHcys-induced glomerular damage in mice. (A) Summarized data showing the urinary protein excretion rate from different groups of mice (n = 6). (B) Summarized data showing the urine albumin excretion rate from different groups of mice (n = 6). (C) Images showing the glomerular morphologic changes from different groups of mice and summarized data (n = 6). *p < 0.05 versus WT-Vehicle (Vehl)-ND group, #p < 0.05 versus WT-Vehl-FF group.

