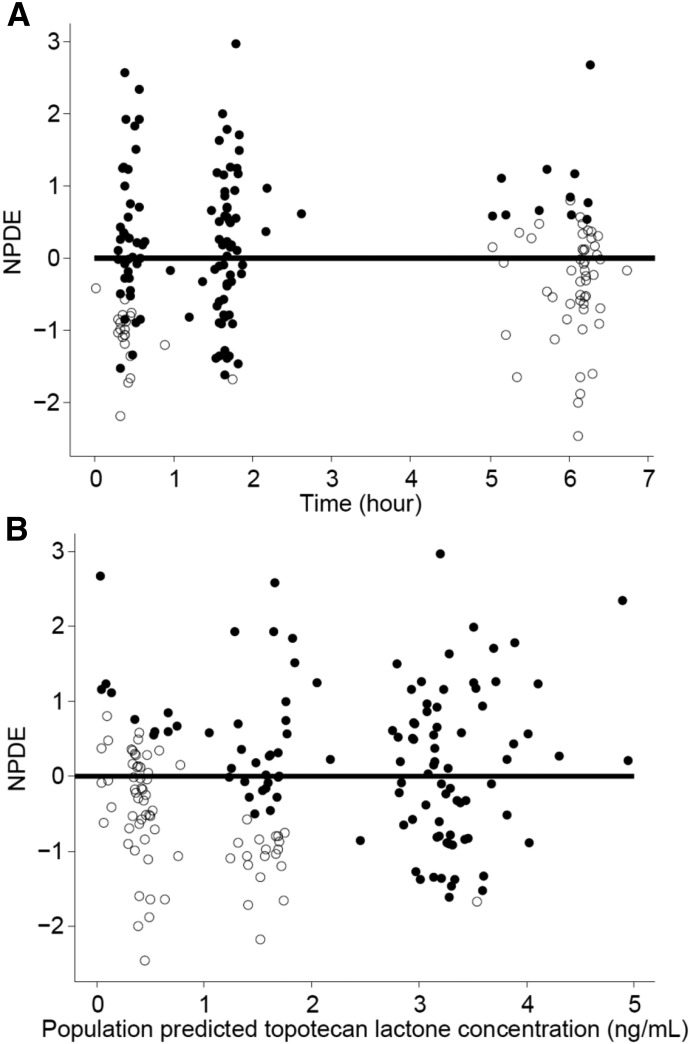
Fig. 4.
The normalized prediction distribution errors (NPDE) plotted against time (A) and population predicted topotecan lactone concentrations (B). The closed circles represent data above the lower limit of quantitation, the open circles represent data below the limit of quantitation or simulated data, and the solid line is the reference line at zero.

