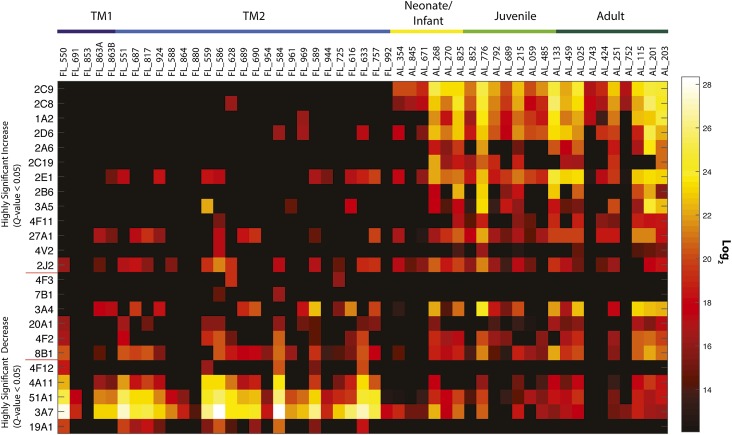
Fig. 4.
Activity-based protein profiling of P450 enzymes, quantified by the AMT tag approach. Comparison of the average probe-enriched P450s from the prenatal first trimester (TM1) and prenatal second trimester (TM2) groups to the average expression of neonate/infant, juvenile, and adult groups is demonstrated through a Q test value, which represents a significance metric applied to the various statistical analyses. Q test values <0.05 represent high confidence determination that protein abundance values increase or decrease when going from prenatal to postnatal samples. Samples increase in age from left to right. Values correlating to the heatmap are provided in Supplemental Dataset 9. Quantitative LC-MS values at the peptide level are provided in Supplemental Dataset 10.

