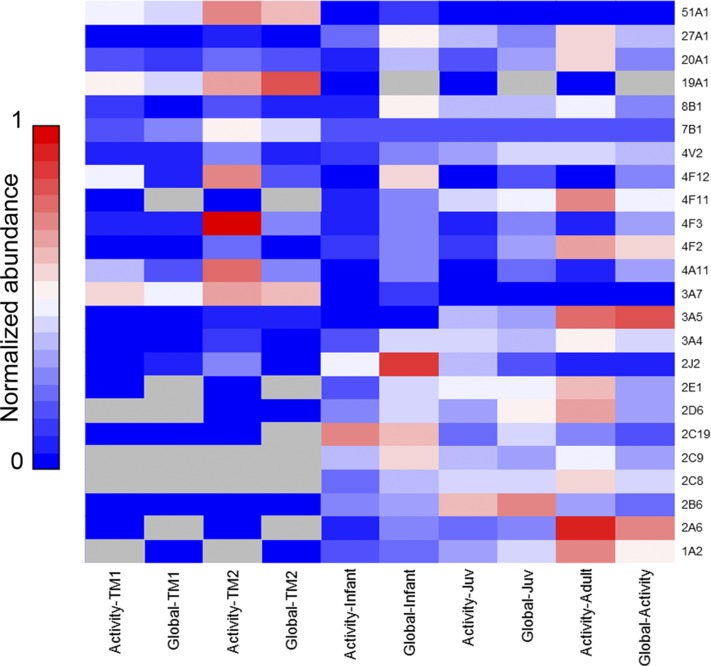
Fig. 5.
Comparison of P450 protein abundance to P450 activity (as determined by ABPP). Activity and protein expression values are averaged by life stage, and normalized on a 0–1 scale for each P450. Thereby, points of highest expression or activity for each P450 are observed as increasingly red. See also Supplemental Figure 1.

