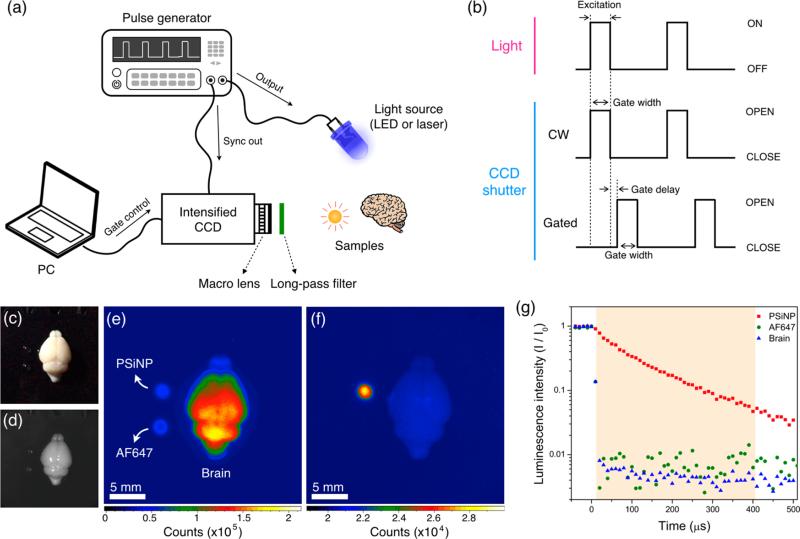
Figure 1.
Methodology and example of data obtained for gated luminescence imaging of Si nanoparticles (GLISiN) compared with steady-state imaging. (a) Schematic showing the instrumental setup. The iCCD camera and the light source were controlled by an external pulse generator. In the case of laser illumination, the laser fired under control of the laser's internal pulse generator, and the camera was configured to slave to it via TTL trigger. (b) Notional waveforms for illumination and camera gating used to acquire images. LED was triggered “ON” by the pulse generator, maintained in the “ON” position for the duration of “Gate width”, and then image acquisition terminated (“CLOSE”) at the end of the “Gate width” period. For the laser experiments, the laser fired at the beginning of “Gate width” but was only “ON” for the duration of the natural pulse width of the laser (~8 ns). For GLISiN imaging (“Gated”), the camera was preprogrammed to energize the intensifier screen (“OPEN”) at a time delayed by “Gate delay” relative to the end of the excitation pulse. For continuous wave (“CW”) imaging, the camera was again programmed to be “OPEN” for the “Gate width” period, but the “Gate width” period overlapped with the laser or LED excitation pulse, generating a pseudo steady-state measurement. (c) Digital color photograph (from iPhone 5, Apple Inc.) and (d) gray scale image (from Andor iCCD) of mouse brain obtained under ambient light. (e) CW and (f) GLISiN images of the same brain under UV LED excitation (λex= 365 nm, λem= 460 nm long-pass filter; gate width, 400 μs, 40 accumulations, gate delay for CW = 0 μs, gate delay for GLISiN = 5 μs). Phantom samples corresponding to 150 ng of porous Si nanoparticles (“PSiNP”) and 2.5 ng of the molecular dye Alexa Fluor 647 (“AF647”) were dropped next to the brain for comparison, as indicated. Note that the signals from the AF647 sample (fluorescence) and the brain tissue (autofluorescence), readily visible at steady state (e), almost disappear in the GLISiN image (f), whereas the longer-lived luminescence from PSiNP is much stronger in the GLISiN image. (g) Normalized intensity decay of the photoluminescence/fluorescence signals from the samples in (c–f) as a function of time after excitation pulse (gate width, 10 μs; gate step increase, 10 μs; accumulation, 20 times). Note the nanosecond decay times of the organic dye and tissue autofluorescence are too short to be resolved at the measurement time scale. The orange box depicts the “Gate width” window used to obtain GLISiN images in (f).

