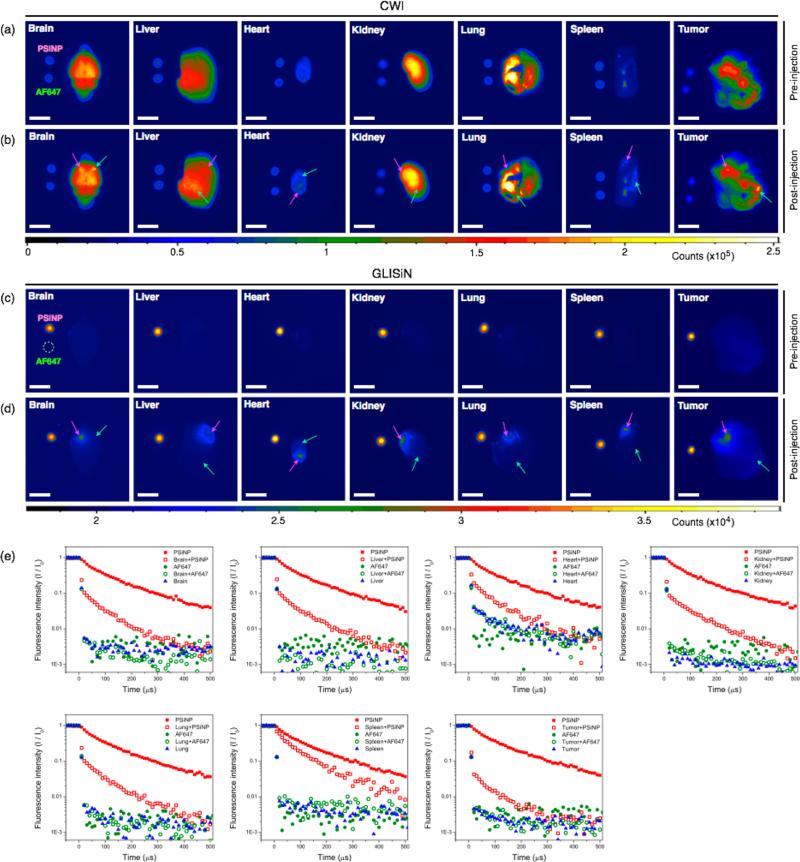
Figure 2.
Comparison of fluorescence and time-gated luminescence images of mouse tissues before and after localized injection of porous Si nanoparticles (PSiNPs) and the molecular dye (AF647). (a) CW images of organs (as indicated) harvested from a 4T1 breast tumor-bearing BALB/c mouse before local injection of imaging agents. Aliquots (5 μL) of the PSiNP (100 μg/mL, corresponding to 500 ng) and AF647 (1.5 μg/mL, corresponding to 7.5 ng) imaging agents are spotted to the left of each tissue for comparison. (b) CW images of the same organs, after local injection of PSiNP (200 ng) and AF647 (3 ng) in the locations indicated by pink and green arrows, respectively. Both imaging agents are difficult to discern against tissue autofluorescence. (c) GLISiN images of the same organs before injection of imaging agents, as in (a). (d) GLISiN images of the same organs after injection of imaging agents, as in (b). Scale bar: 5 mm. Samples were not moved between CW and GLISiN image acquisition. (e) Normalized intensity of the photoluminescence/fluorescence signals as a function of time after excitation pulse. Red solid squares, PSiNPs in the phantom image (spotted adjacent to each organ); red open squares, PSiNP-injected tissue region; green solid circles, AF647 in the phantom image (spotted adjacent to each organ); green open circles, AF647-injected tissue region; blue solid triangles, tissue control (away from region of either injection). Optical setup, long-pass filter, excitation source (365 nm UV LED) and gating parameters the same as in Figure 1.

