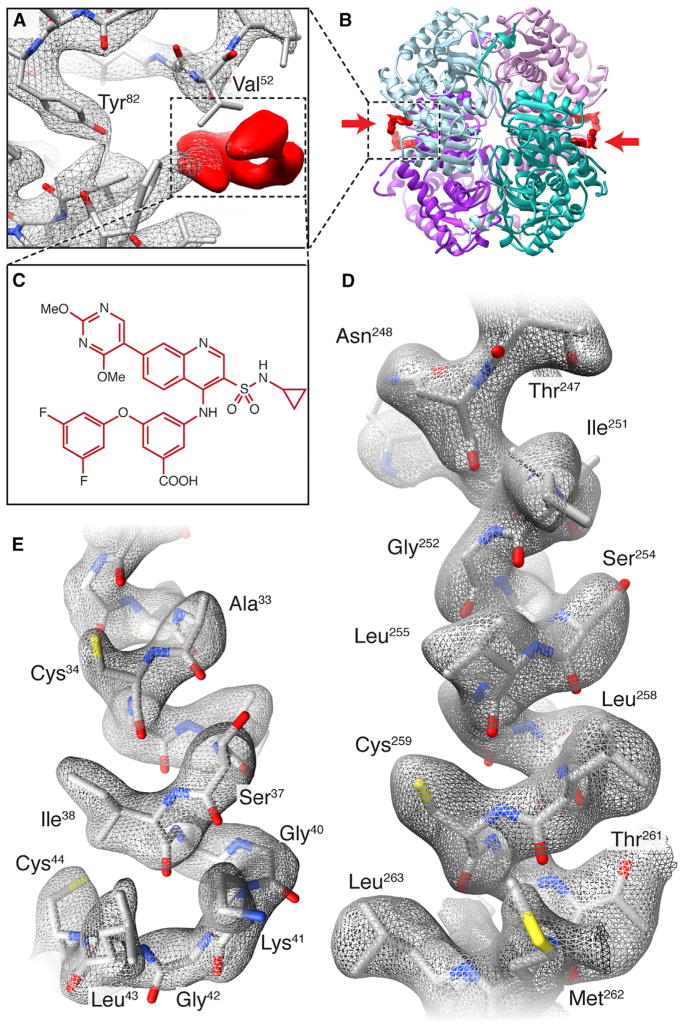
Figure 1. Cryo-EM Analysis of LDHB Bound to Inhibitor GSK2837808A.
(A) Cryo-EM density map of complex showing density for GSK2837808A (red) and selected residues in the binding pocket.
(B) Ribbon diagram of refined structure of LDHB showing the location of the bound inhibitor (marked by arrows) on the periphery of the tetramer.
(C) Structure of GSK2837808A.
(D and E) Visualization of side-chains in the cryo-EM density map in an α-helical segment (D) and loop region (E) of the polypeptide.
See also Figure S1.

