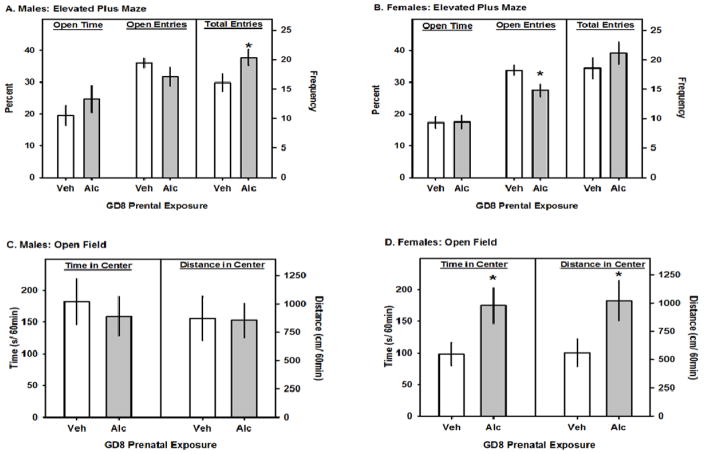
Fig. 1.
The effects of GD8 alcohol exposure on elevated plus maze and open field behavior. A and B. In each panel the left pairs of bars represent the percentage of time on the open arms and correspond to the left y-axis. The center pairs of bars represent the percentage of total arm entries that were made onto the open arms and correspond to the left y-axis. The total arm entries are represented by the right pair of bars and correspond to the right y-axis. C and D. In each panel the left pairs of bars represent the total time that was spent in the center of open field and correspond to the left y-axis. The right pairs of bars represent the total time distance (cm) that was travelled in the center of open field and correspond to the right y-axis. All data are means ± 1 SEM and asterisks denote significance vs. Veh, p<0.05.

