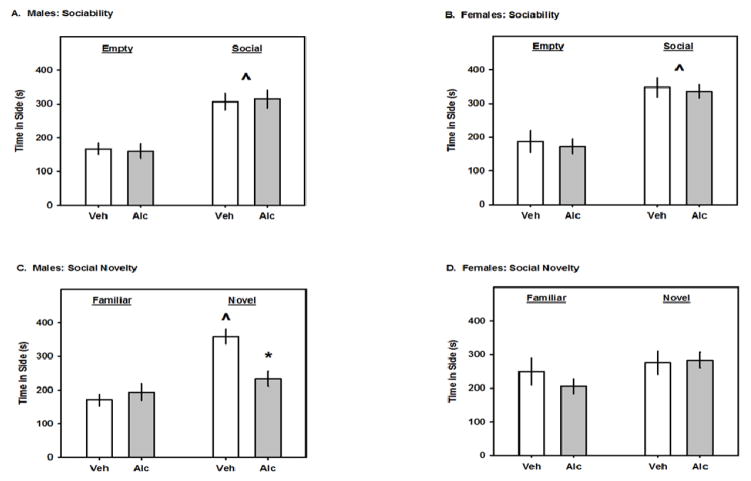
Fig. 2.
The effects of GD8 alcohol exposure on social behaviors in the three-chambered test. A and B. In each panel, the left and right pairs of bars represent the time spent on the side that contained the non-social, or the social stimulus, respectively. C and D. In each panel, the left and right pairs of bars represent the time spent on the side that contained the familiar, or novel, social stimulus, respectively. All data are means ± 1 SEM. Carets denote significance vs. Empty or Familiar and asterisks denote significance vs. Veh, p<0.05.

