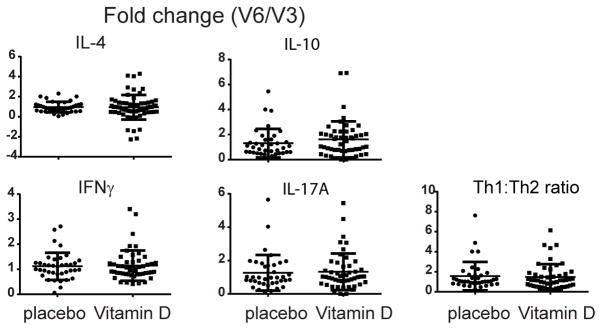
Figure 1. Intracellular cytokine analysis of CD4+ T cells.
Peripheral blood samples were obtained prior to (V3) and after (V6) 12 weeks of treatment with placebo or vitamin D. Intracellular cytokine staining of CD4+ T cells was performed and the percentage of CD4+ T cells expressing IL-4, IFNγ, IL-10 or IL-17A determined. Shown is the fold change from V3 to V6, calculated as the ratio of the V6 value divided by the V3 value for each sample pair. There was no difference in this ratio between vitamin D- and placebo-treated participants. The Th1:Th2 ratio, calculated by dividing the percentage of CD4/IFNγ positive by the percentage of CD4/IL-4 positive cells, was also not different. Shown are individual data points and lines representing the mean ± standard deviation.

