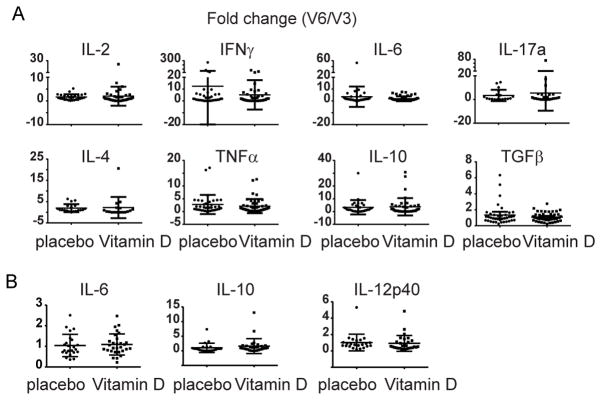
Figure 2. Cytokine secretion by stimulated PBMCs and monocytes.
A) PBMCs were isolated from samples collected either before (V3) or after (V6) vitamin D supplementation or placebo, and stimulated with α-CD3 and α-CD28 for 48 hours. Secreted cytokines were analyzed in the culture supernatant by cytokine bead array or ELISA (TGFβ only). The fold change from V3 to V6 was calculated by dividing the value at V6 by the value at V3 for each sample pair. B) CD14+ monocytes were isolated from PBMC from vitamin D-deficient asthmatics before (V3) and after (V6) vitamin D supplementation or placebo and stimulated with LPS for 48 hours. IL-6, IL-10 and IL-12p40 production was determined by ELISA. The fold change from V6 to V3 (V6/V3) for each sample pair was calculated and shown are individual data points and lines representing the mean ± standard deviation.

