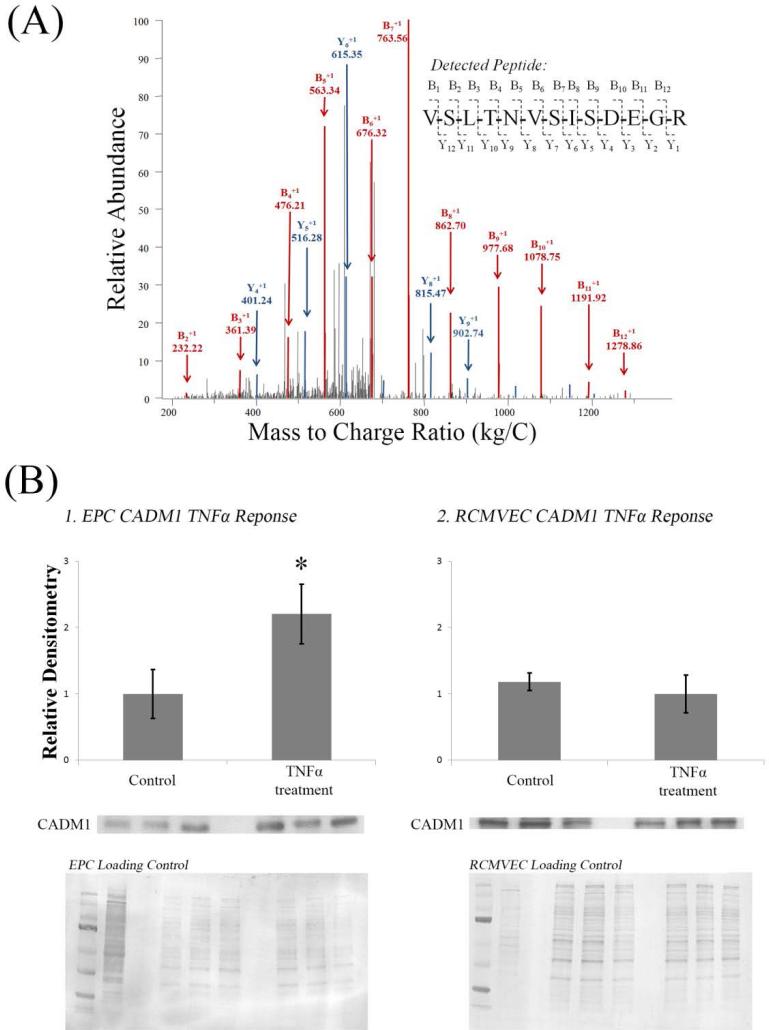
Figure 5. Validation of CADM1 as a Candidate Protein Pair.
(A) Example LC-MS/MS Spectra. 16 scans of the peptide sequenced ‘VSLTNVSISDEGR’ were observed in the CSC TNFα treated EPC data set. The peptide has 12 potential peptide fragmentation sites and therefore 12 potential ‘B’ and ‘Y’ ions. Following peptide fragmentation, the following m/z spectra was obtained. 11 ‘B’ ions were observed (11 shown) and 9 ‘Y’ ions were observed (5 shown).
(B) Western blot analysis was conducted to confirm quantitation via spectral counting of CADM1 in EPCs (1) and RCMVECs (2). Statistically significant regulation was observed in EPCs, but not RCMVECs confirming proteomics results. Quantitation was performed by normalizing CADM1 bands to total protein detected on the membrane via coomassie staining.

