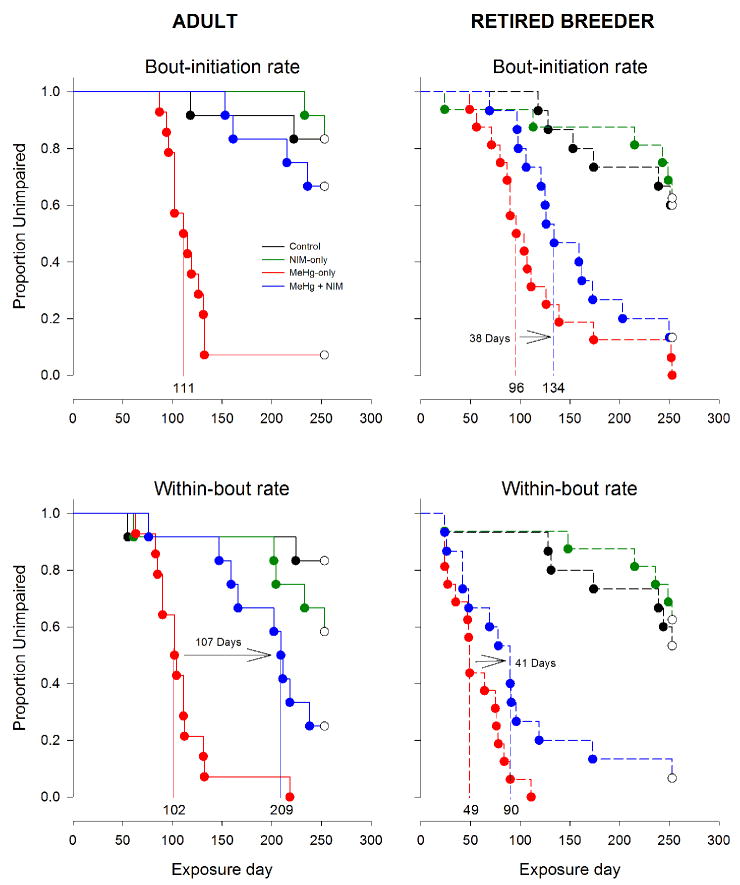
Figure 5.
Event analyses (survival analysis) for bout-initiation rate (top panel) and within-bout rate (bottom panel), separated by age (left and right). Shown near the abscissa of each Kaplan-Meier plot are the median latencies to impairment for the MeHg-only and MeHg + NIM exposure groups, as well as the difference between the two groups. Exposure groups: black = control, green = NIM-only, red = MeHg-only, and blue = MeHg + NIM.

