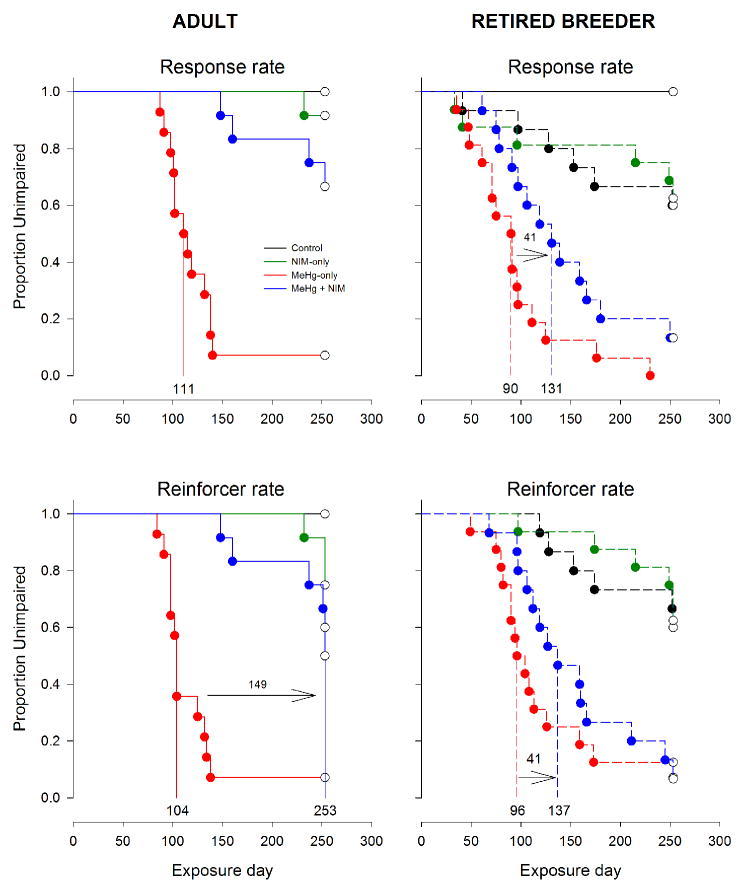
Figure 6.
Event analyses (survival analysis) for response rate (top panel) and reinforcer rate (bottom panel), separated by age (left and right). The format is the same as Fig. 5. Note that for response rate, too few adult MeHg + NIM animals reached impairment to determine median latency to impairment. Exposure groups: black = control, green = NIM-only, red = MeHg-only, and blue = MeHg + NIM.

