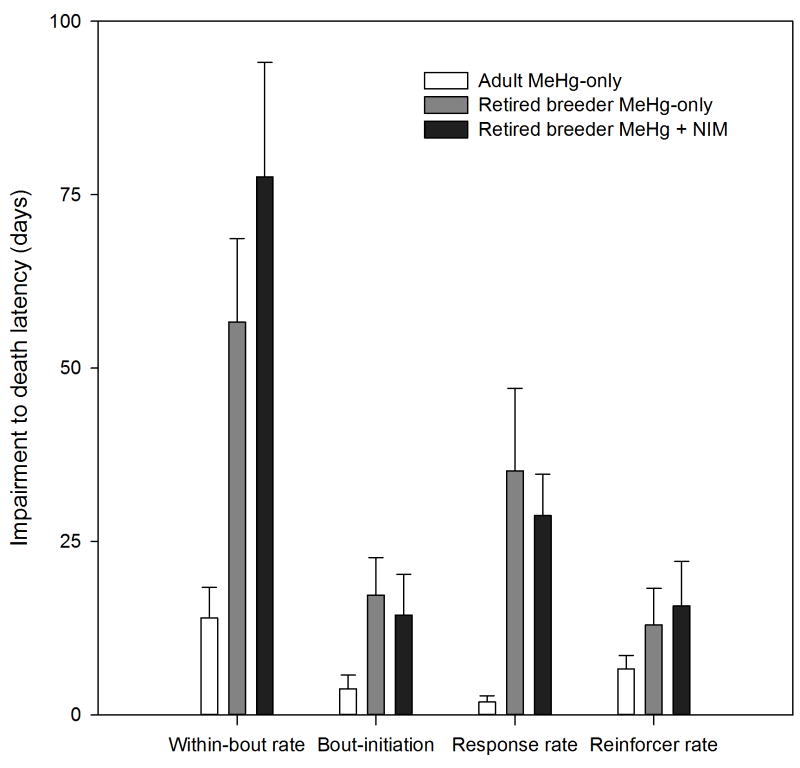
Figure 7.
The bar chart show the average latency (±SEM) from impairment to death for four measures. Note that the adult MeHg + NIM group is excluded because so few animals died from MeHg toxicity (see text for details). The latency from impairment to death was longest for within-bout rate (*, all p’s<0.001). For within-bout rate and response rate, the average latency for adult MeHg-only animals was significantly shorter compared to retired breeder MeHg-only and MeHg + NIM animals (#, all p’s<0.001)

