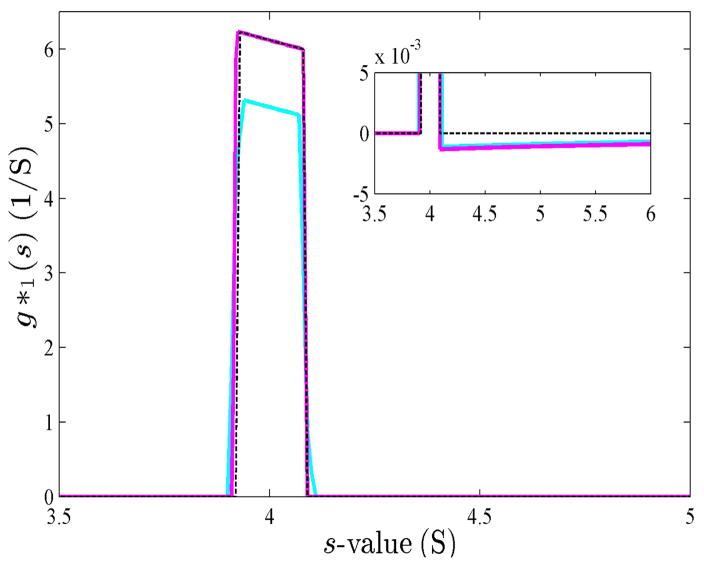
Fig. 3.
Response function for step-function boundaries of a single 4 S species sedimenting at 50,000 rpm, observed at 7,200 and 7,500 sec. Shown are the resulting g(s*) from DCDT (kindly provided by Dr. Walter Stafford) as solid cyan line, the result from DCDT+ (kindly provided by Dr. John Philo) as solid magenta line, and the theoretical prediction Eq. (27) as black dotted line.

