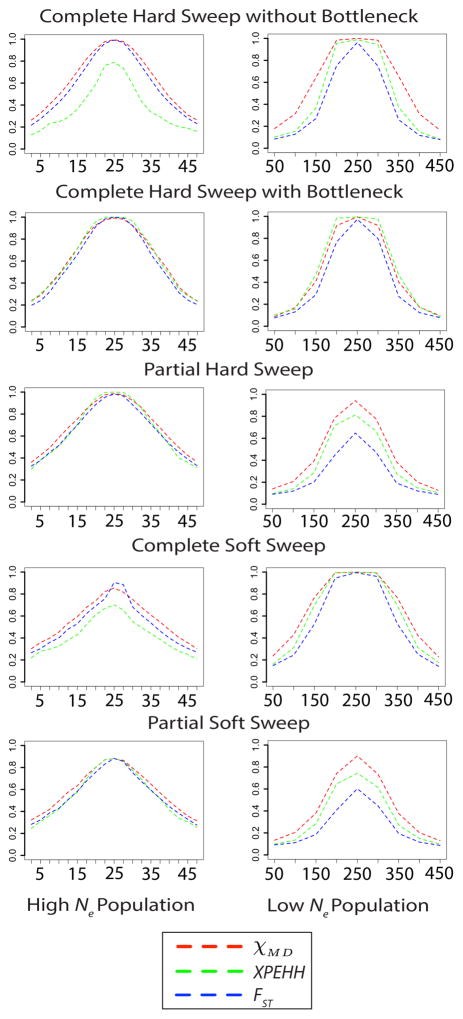
Figure 10.
For a subset of sweep scenarios, this figure illustrates the decay of all three statistics’ power by distance (kilobases on the x axis). In the non-bottleneck complete hard sweep, the high Ne populations split at 0.5 time units in the past and selection (s = 0.001) began at 0.2 time units in the past. In the low Ne population, the populations split at 0.2 time units in the past and selection (s = 0.01) began immediately. The bottleneck strength in the high Ne case is 0.05 and the low Ne case is 0.1. In both cases of the partial hard sweep, the ending allele frequencies were 0.5. In the complete soft sweep cases for both populations, starting frequency was 0.001. In the partial soft sweep cases for the high Ne case, starting allele frequency was 0.0001 and ending allele frequency was 0.5. For the high Ne case, beneficial starting allele frequency was 0.001 and ended at 0.5.

